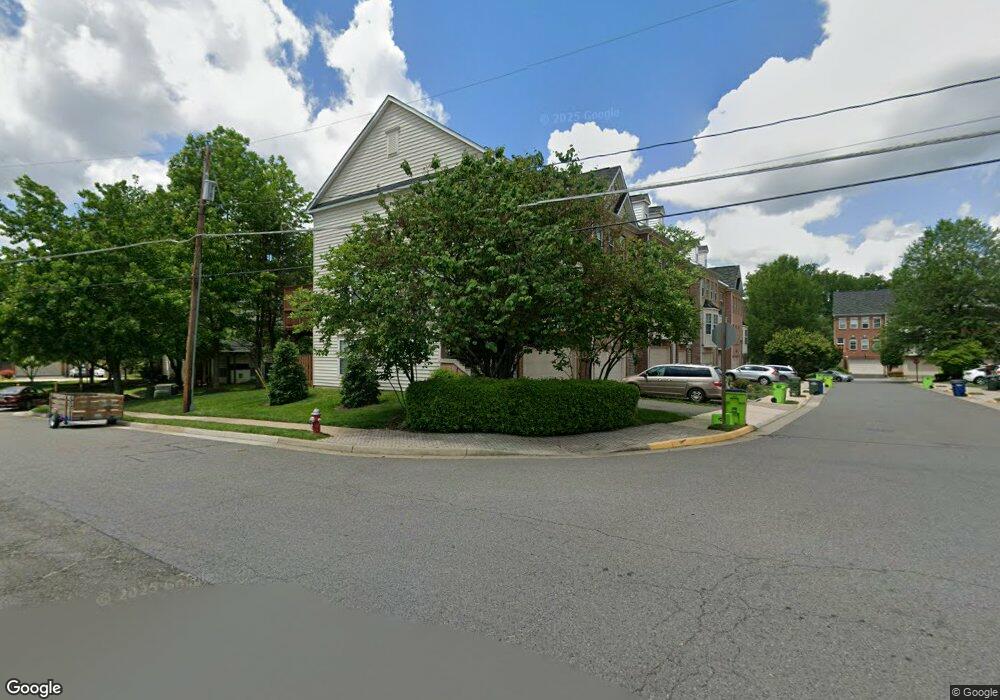
4522 Billingham St Fairfax, VA 22030
Estimated Value: $771,769 - $817,000
3
Beds
4
Baths
1,812
Sq Ft
$436/Sq Ft
Est. Value
About This Home
This home is located at 4522 Billingham St, Fairfax, VA 22030 and is currently estimated at $789,692, approximately $435 per square foot. 4522 Billingham St is a home located in Fairfax County with nearby schools including Eagle View Elementary School, Johnson Middle School, and Fairfax High.
Ownership History
Date
Name
Owned For
Owner Type
Purchase Details
Closed on
Sep 3, 2020
Sold by
Gullanki Venkateswara R
Bought by
Gullanki Venkateswara R and Gullanki Aruna Rani
Current Estimated Value
Home Financials for this Owner
Home Financials are based on the most recent Mortgage that was taken out on this home.
Original Mortgage
$451,000
Outstanding Balance
$381,336
Interest Rate
2.75%
Mortgage Type
New Conventional
Estimated Equity
$408,356
Purchase Details
Closed on
Sep 25, 2014
Sold by
Vasudeva Jyoti
Bought by
Gullanki Venkateswara R
Home Financials for this Owner
Home Financials are based on the most recent Mortgage that was taken out on this home.
Original Mortgage
$513,000
Interest Rate
4.12%
Mortgage Type
New Conventional
Purchase Details
Closed on
Jan 31, 2005
Sold by
Fair Chase Development Ll
Bought by
Vasudeva Jyoti
Home Financials for this Owner
Home Financials are based on the most recent Mortgage that was taken out on this home.
Original Mortgage
$389,200
Interest Rate
5.67%
Mortgage Type
New Conventional
Create a Home Valuation Report for This Property
The Home Valuation Report is an in-depth analysis detailing your home's value as well as a comparison with similar homes in the area
Home Values in the Area
Average Home Value in this Area
Purchase History
| Date | Buyer | Sale Price | Title Company |
|---|---|---|---|
| Gullanki Venkateswara R | -- | Accommodation | |
| Gullanki Venkateswara R | $540,000 | -- | |
| Vasudeva Jyoti | $493,810 | -- |
Source: Public Records
Mortgage History
| Date | Status | Borrower | Loan Amount |
|---|---|---|---|
| Open | Gullanki Venkateswara R | $451,000 | |
| Closed | Gullanki Venkateswara R | $513,000 | |
| Previous Owner | Vasudeva Jyoti | $389,200 |
Source: Public Records
Tax History Compared to Growth
Tax History
| Year | Tax Paid | Tax Assessment Tax Assessment Total Assessment is a certain percentage of the fair market value that is determined by local assessors to be the total taxable value of land and additions on the property. | Land | Improvement |
|---|---|---|---|---|
| 2025 | $7,844 | $719,340 | $215,000 | $504,340 |
| 2024 | $7,844 | $677,090 | $200,000 | $477,090 |
| 2023 | $7,252 | $642,600 | $200,000 | $442,600 |
| 2022 | $6,936 | $606,550 | $180,000 | $426,550 |
| 2021 | $6,558 | $558,810 | $155,000 | $403,810 |
| 2020 | $6,496 | $548,910 | $155,000 | $393,910 |
| 2019 | $6,400 | $540,730 | $150,000 | $390,730 |
| 2018 | $5,893 | $512,400 | $150,000 | $362,400 |
| 2017 | $5,949 | $512,400 | $150,000 | $362,400 |
| 2016 | $5,936 | $512,400 | $150,000 | $362,400 |
| 2015 | $5,618 | $503,400 | $145,000 | $358,400 |
| 2014 | $5,411 | $485,940 | $140,000 | $345,940 |
Source: Public Records
Map
Nearby Homes
- 12128 Garden Ridge Ln Unit 203
- 12148 Garden Grove Cir Unit 403
- 12307 W Oaks Dr
- 4401 Weatherington Ln Unit 401
- 4634 Battenburg Ln Unit 631
- 4683 Eggleston Terrace Unit 232
- 4627 Battenburg Ln Unit 942
- 12045 Overbridge Ln
- 4479B Beacon Grove Cir
- 12098 Antler Ct
- 12426A Liberty Bridge Rd
- 4225 Mozart Brigade Ln Unit 94
- 4225 Mozart Brigade Ln Unit 84
- 4703 Marymead Dr
- 4480 Market Commons Dr Unit 505
- 4480 Market Commons Dr Unit 416
- 4200 Mozart Brigade Ln
- 4490 Market Commons Dr Unit 302
- 4490 Market Commons Dr Unit 202
- 4490 Market Commons Dr Unit 602
- 4520 Billingham St
- 4524 Billingham St
- 4518 Billingham St
- 4516 Billingham St
- 4514 Billingham St
- 4512 Billingham St
- 4523 Billingham St
- 4521 Billingham St
- 4525 Billingham St
- 4517 Billingham St
- 4533 English Holly Dr
- 4531 English Holly Dr
- 4510 Billingham St
- 4535 English Holly Dr
- 4529 English Holly Dr
- 4515 Billingham St
- 4527 English Holly Dr
- 4525 English Holly Dr
- 4513 Billingham St
- 4523 English Holly Dr