4523 Fieldstone Cir SE Southport, NC 28461
Estimated Value: $1,008,337 - $1,162,000
4
Beds
4
Baths
3,704
Sq Ft
$291/Sq Ft
Est. Value
About This Home
This home is located at 4523 Fieldstone Cir SE, Southport, NC 28461 and is currently estimated at $1,077,084, approximately $290 per square foot. 4523 Fieldstone Cir SE is a home located in Brunswick County with nearby schools including Virginia Williamson Elementary School, South Brunswick Middle School, and South Brunswick High School.
Ownership History
Date
Name
Owned For
Owner Type
Purchase Details
Closed on
Apr 7, 2021
Sold by
Cleary David W and Cleary Mary Anne
Bought by
Cleary David W and Cleary Mary Anne
Current Estimated Value
Home Financials for this Owner
Home Financials are based on the most recent Mortgage that was taken out on this home.
Original Mortgage
$162,500
Outstanding Balance
$120,513
Interest Rate
2.38%
Mortgage Type
New Conventional
Estimated Equity
$956,571
Purchase Details
Closed on
Jun 1, 2018
Sold by
Cleary David W and Cleary Mary Anne
Bought by
Cleary David W and Cleary Mary Anne
Purchase Details
Closed on
Jul 18, 2005
Sold by
Mccrystal James P and Mccrystal Margaret
Bought by
Cleary David W and Cleary Mary Anne
Home Financials for this Owner
Home Financials are based on the most recent Mortgage that was taken out on this home.
Original Mortgage
$112,000
Interest Rate
5.54%
Mortgage Type
FHA
Create a Home Valuation Report for This Property
The Home Valuation Report is an in-depth analysis detailing your home's value as well as a comparison with similar homes in the area
Home Values in the Area
Average Home Value in this Area
Purchase History
| Date | Buyer | Sale Price | Title Company |
|---|---|---|---|
| Cleary David W | -- | None Available | |
| David W Cleary And Mary Anne Cleary Revocable | -- | None Listed On Document | |
| Cleary David W | -- | None Available | |
| Cleary David W | $124,500 | None Available |
Source: Public Records
Mortgage History
| Date | Status | Borrower | Loan Amount |
|---|---|---|---|
| Open | David W Cleary And Mary Anne Cleary Revocable | $162,500 | |
| Closed | David W Cleary And Mary Anne Cleary Revocable | $162,500 | |
| Previous Owner | Cleary David W | $112,000 |
Source: Public Records
Tax History Compared to Growth
Tax History
| Year | Tax Paid | Tax Assessment Tax Assessment Total Assessment is a certain percentage of the fair market value that is determined by local assessors to be the total taxable value of land and additions on the property. | Land | Improvement |
|---|---|---|---|---|
| 2025 | $3,655 | $827,240 | $247,500 | $579,740 |
| 2024 | $3,655 | $827,240 | $247,500 | $579,740 |
| 2023 | $3,785 | $827,240 | $247,500 | $579,740 |
| 2022 | $3,785 | $647,250 | $115,000 | $532,250 |
| 2021 | $3,785 | $647,250 | $115,000 | $532,250 |
| 2020 | $3,785 | $647,250 | $115,000 | $532,250 |
| 2019 | $3,785 | $118,790 | $115,000 | $3,790 |
| 2018 | $3,440 | $89,500 | $85,000 | $4,500 |
| 2017 | $3,440 | $89,500 | $85,000 | $4,500 |
| 2016 | $3,440 | $89,500 | $85,000 | $4,500 |
| 2015 | $3,441 | $598,500 | $85,000 | $513,500 |
| 2014 | $3,222 | $605,000 | $187,500 | $417,500 |
Source: Public Records
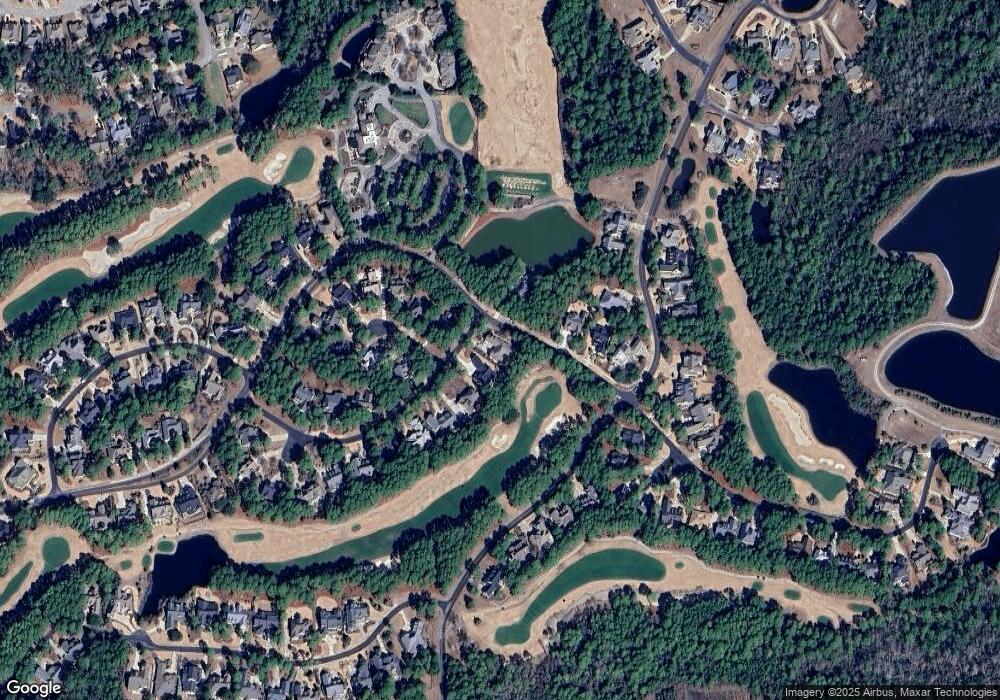
Map
Nearby Homes
- 4510 Fieldstone Cir
- 3712 Fairfield Way
- 4490 Millwright Cir
- 4481 Regency Crossing
- 4135 Skeffington Ct
- 3705 Fairfield Way
- 3838 Winding Vine Way
- 4175 9th St SE
- 4135 9th St SE
- 3965 Pepperberry Ln
- 3973 Pepperberry Ln
- 3918 Meeting Place Ln
- 3914 Meeting Place
- 3905 Meeting Place
- 3882 White Blossom Cir
- 4224 Cherry Laurel Ln SE
- 4226 Cherry Laurel Ln SE
- 4238 Cherry Laurel Dr
- 4239 Ashfield Place
- 3803 Harmony Cir
- 3700 Players Club Dr SE
- 4519 Fieldstone Cir SE
- 4498 Lenox Ct
- 3704 Players Club SE
- 3708 Players Club Dr
- 3708 Players Club Dr
- 4496 Lenox Ct
- 4517 Fieldstone Cir SE
- 3712 Players Club Dr
- 4495 Lenox Ct SE
- 4497 Lenox Ct
- 4493 Regency Crossing
- 4494 Lenox Ct
- 4515 Fieldstone Cir SE
- 3716 Players Club Dr SE
- 4521 Fieldstone Cir SE
- 4492 Lenox Ct
- 4512 Fieldstone Cir SE
- 4487 Regency Crossing
- 4513 Fieldstone Cir SE