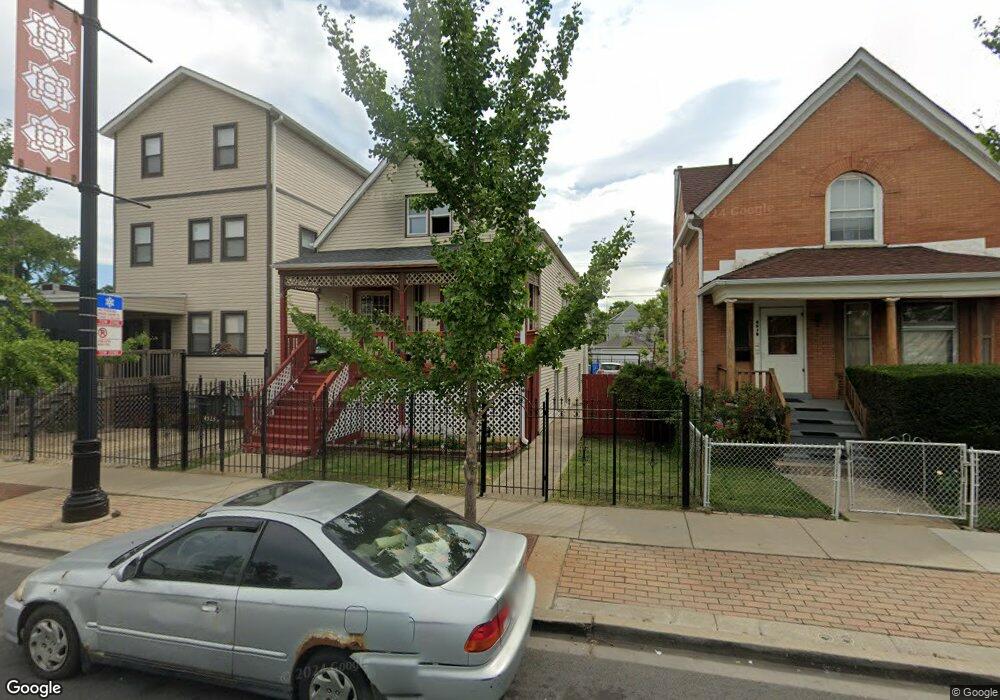
4523 N Pulaski Rd Chicago, IL 60630
Albany Park NeighborhoodEstimated Value: $414,000 - $484,000
4
Beds
2
Baths
968
Sq Ft
$454/Sq Ft
Est. Value
About This Home
This home is located at 4523 N Pulaski Rd, Chicago, IL 60630 and is currently estimated at $439,013, approximately $453 per square foot. 4523 N Pulaski Rd is a home located in Cook County with nearby schools including Haugan Elementary School, Roosevelt High School, and ASPIRA Haugan Middle School.
Ownership History
Date
Name
Owned For
Owner Type
Purchase Details
Closed on
Mar 28, 2025
Sold by
Ulloa Felipe De Jesus and Viverito Lisa R
Bought by
Felipe Ulloa Living Trust and Ulloa
Current Estimated Value
Purchase Details
Closed on
Oct 13, 2023
Sold by
Ulloa Felipe
Bought by
Dejesus Ulloa Felipe
Home Financials for this Owner
Home Financials are based on the most recent Mortgage that was taken out on this home.
Original Mortgage
$255,000
Interest Rate
7.13%
Mortgage Type
New Conventional
Purchase Details
Closed on
Jan 8, 2002
Sold by
Ullca Felipe and Bautista Tarcila
Bought by
Ulloa Felipe
Home Financials for this Owner
Home Financials are based on the most recent Mortgage that was taken out on this home.
Original Mortgage
$124,000
Interest Rate
7.16%
Purchase Details
Closed on
Dec 27, 1993
Sold by
Kero Edward P and Kero Laura
Bought by
Ulloa Felipe and Bautista Tarcila
Home Financials for this Owner
Home Financials are based on the most recent Mortgage that was taken out on this home.
Original Mortgage
$93,100
Interest Rate
7.35%
Create a Home Valuation Report for This Property
The Home Valuation Report is an in-depth analysis detailing your home's value as well as a comparison with similar homes in the area
Home Values in the Area
Average Home Value in this Area
Purchase History
| Date | Buyer | Sale Price | Title Company |
|---|---|---|---|
| Felipe Ulloa Living Trust | -- | None Listed On Document | |
| Dejesus Ulloa Felipe | $340,000 | Saturn Title | |
| Ulloa Felipe | -- | -- | |
| Ulloa Felipe | $65,333 | -- |
Source: Public Records
Mortgage History
| Date | Status | Borrower | Loan Amount |
|---|---|---|---|
| Previous Owner | Dejesus Ulloa Felipe | $255,000 | |
| Previous Owner | Ulloa Felipe | $124,000 | |
| Previous Owner | Ulloa Felipe | $93,100 |
Source: Public Records
Tax History Compared to Growth
Tax History
| Year | Tax Paid | Tax Assessment Tax Assessment Total Assessment is a certain percentage of the fair market value that is determined by local assessors to be the total taxable value of land and additions on the property. | Land | Improvement |
|---|---|---|---|---|
| 2024 | $5,862 | $34,001 | $16,405 | $17,596 |
| 2023 | $5,693 | $31,000 | $13,124 | $17,876 |
| 2022 | $5,693 | $31,000 | $13,124 | $17,876 |
| 2021 | $5,582 | $30,999 | $13,123 | $17,876 |
| 2020 | $5,209 | $26,403 | $6,796 | $19,607 |
| 2019 | $5,289 | $29,667 | $6,796 | $22,871 |
| 2018 | $5,198 | $29,667 | $6,796 | $22,871 |
| 2017 | $4,213 | $22,881 | $6,093 | $16,788 |
| 2016 | $4,344 | $24,113 | $6,093 | $18,020 |
| 2015 | $4,074 | $24,779 | $6,093 | $18,686 |
| 2014 | $3,055 | $18,973 | $5,624 | $13,349 |
| 2013 | $3,801 | $23,452 | $5,624 | $17,828 |
Source: Public Records
Map
Nearby Homes
- 4461 N Pulaski Rd
- 4515 N Karlov Ave
- 4533 N Karlov Ave
- 4387 N Elston Ave
- 4101 W Montrose Ave
- 4602 N Springfield Ave
- 4614 N Springfield Ave
- 4545 N Kedvale Ave
- 4624 N Springfield Ave
- 3816 W Montrose Ave
- 4337 N Kedvale Ave Unit 206
- 4337 N Kedvale Ave Unit 2E
- 4515 N Hamlin Ave
- 4342 N Kedvale Ave Unit 2A
- 4109 W Eastwood Ave Unit 2
- 4731 N Keystone Ave
- 4243 N Keystone Ave Unit GN
- 4239 N Keystone Ave Unit 3S
- 4606 N Kelso Ave
- 4460 N Tripp Ave
- 4519 N Pulaski Rd
- 4525 N Pulaski Rd
- 4525 N Pulaski Rd
- 4525 N Pulaski Rd Unit 2
- 4525 N Pulaski Rd Unit 1
- 4515 N Pulaski Rd
- 4527 N Pulaski Rd
- 4511 N Pulaski Rd
- 4511 N Pulaski Rd Unit 2
- 4508 N Harding Ave
- 4514 N Harding Ave
- 4506 N Harding Ave
- 4518 N Harding Ave
- 4512 N Harding Ave
- 4512 N Harding Ave
- 4512 N Harding Ave Unit 1
- 4500 N Harding Ave
- 4520 N Harding Ave
- 4461 N Pulaski Rd
- 4524 N Harding Ave