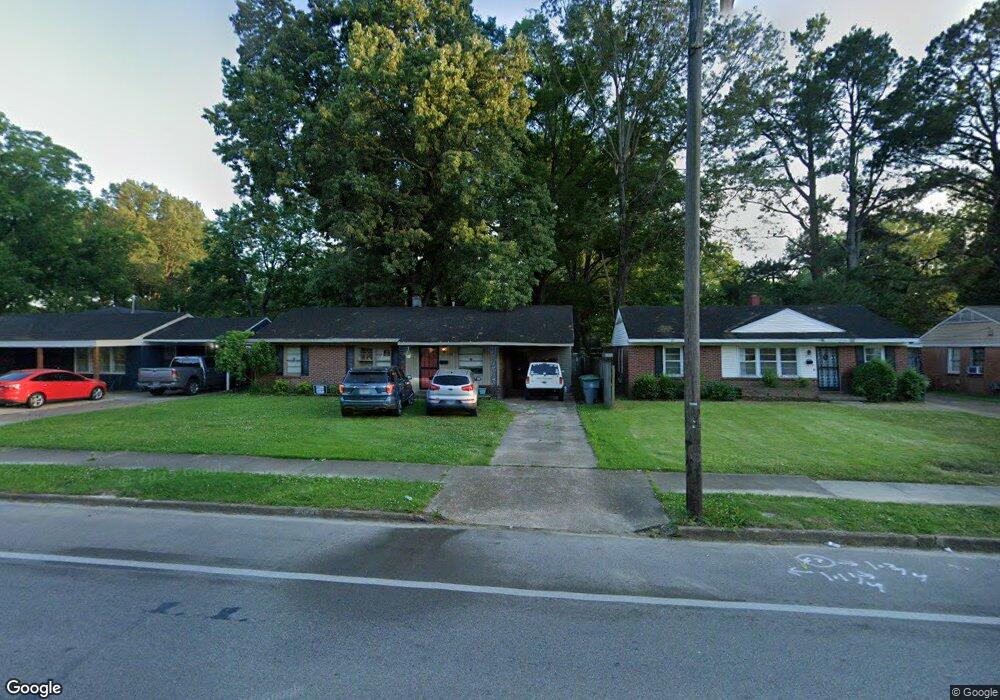
4523 Quince Rd Memphis, TN 38117
Colonial Acres NeighborhoodEstimated Value: $129,000 - $159,875
3
Beds
2
Baths
1,345
Sq Ft
$110/Sq Ft
Est. Value
About This Home
This home is located at 4523 Quince Rd, Memphis, TN 38117 and is currently estimated at $147,469, approximately $109 per square foot. 4523 Quince Rd is a home located in Shelby County with nearby schools including Willow Oaks Elementary School, Colonial Middle, and Overton High.
Ownership History
Date
Name
Owned For
Owner Type
Purchase Details
Closed on
Sep 15, 2011
Sold by
Tate Thomas G and Tate Andrea D
Bought by
Auret Louis J
Current Estimated Value
Home Financials for this Owner
Home Financials are based on the most recent Mortgage that was taken out on this home.
Original Mortgage
$48,800
Outstanding Balance
$33,641
Interest Rate
4.4%
Mortgage Type
New Conventional
Estimated Equity
$113,828
Purchase Details
Closed on
Sep 14, 2006
Sold by
Taft Danny Vance and Duncan Thomas Randall
Bought by
Kelley Bryant R and Kelley Susan D
Purchase Details
Closed on
Aug 4, 2006
Sold by
Duncan Thomas Randall
Bought by
Taff Danny Vance and Duncan Thomas Randall
Purchase Details
Closed on
Aug 6, 1999
Sold by
Inman Doris L
Bought by
Duncan Thomas Randall
Home Financials for this Owner
Home Financials are based on the most recent Mortgage that was taken out on this home.
Original Mortgage
$41,000
Interest Rate
7.65%
Create a Home Valuation Report for This Property
The Home Valuation Report is an in-depth analysis detailing your home's value as well as a comparison with similar homes in the area
Home Values in the Area
Average Home Value in this Area
Purchase History
| Date | Buyer | Sale Price | Title Company |
|---|---|---|---|
| Auret Louis J | $61,000 | Realty Title | |
| Kelley Bryant R | $49,025 | Stewart Title Co Of Memphis | |
| Taff Danny Vance | -- | None Available | |
| Duncan Thomas Randall | -- | -- |
Source: Public Records
Mortgage History
| Date | Status | Borrower | Loan Amount |
|---|---|---|---|
| Open | Auret Louis J | $48,800 | |
| Previous Owner | Duncan Thomas Randall | $41,000 |
Source: Public Records
Tax History Compared to Growth
Tax History
| Year | Tax Paid | Tax Assessment Tax Assessment Total Assessment is a certain percentage of the fair market value that is determined by local assessors to be the total taxable value of land and additions on the property. | Land | Improvement |
|---|---|---|---|---|
| 2025 | $1,053 | $35,350 | $7,200 | $28,150 |
| 2024 | $1,053 | $31,075 | $3,975 | $27,100 |
| 2023 | $1,893 | $31,075 | $3,975 | $27,100 |
| 2022 | $1,893 | $31,075 | $3,975 | $27,100 |
| 2021 | $1,915 | $31,075 | $3,975 | $27,100 |
| 2020 | $1,388 | $16,125 | $3,975 | $12,150 |
| 2019 | $1,168 | $16,125 | $3,975 | $12,150 |
| 2018 | $1,168 | $16,125 | $3,975 | $12,150 |
| 2017 | $663 | $16,125 | $3,975 | $12,150 |
| 2016 | $682 | $15,600 | $0 | $0 |
| 2014 | $682 | $15,600 | $0 | $0 |
Source: Public Records
Map
Nearby Homes
- 4502 Quince Rd
- 4493 Quince Rd
- 4545 Verne Rd
- 4491 Garnett Rd
- 4506 Verne Rd
- 4485 Dunn Ave
- 4491 Fair Meadow Rd
- 4576 Amboy Rd
- 4474 Cherrydale Rd
- 4468 Cherrydale Rd
- 4416 Boyce Rd
- 1305 Cherry Rd
- 1563 Flamingo Rd
- 4420 Helene Rd
- 4487 E Dearing Rd
- 1467 Wanda St
- 1263 S Perkins Rd
- 1220 Perkins Terrace
- 1258 S Perkins Rd
- 4288 Kimball Ave
- 4529 Quince Rd
- 4513 Quince Rd
- 4535 Quince Rd
- 4506 Garnett Rd
- 4510 Garnett Rd
- 4500 Garnett Rd
- 4507 Quince Rd
- 4541 Quince Rd
- 4514 Garnett Rd
- 4496 Garnett Rd
- 4522 Quince Rd
- 4528 Quince Rd
- 4518 Quince Rd
- 4545 Quince Rd
- 4490 Garnett Rd
- 4501 Quince Rd
- 4534 Quince Rd
- 4512 Quince Rd
- 4540 Quince Rd
- 4518 Garnett Rd