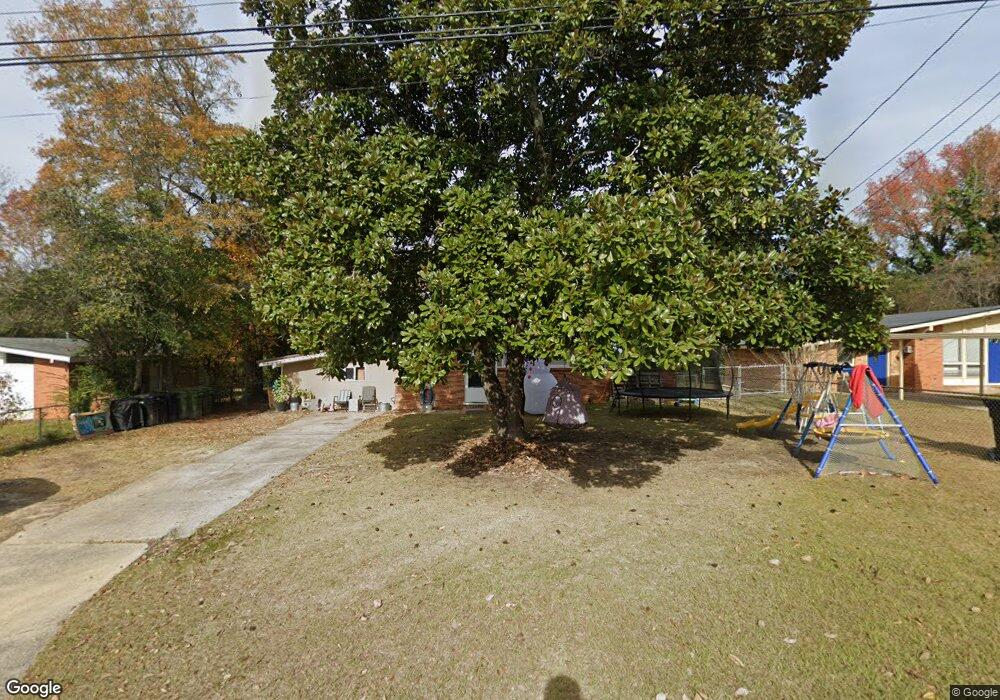
4523 Timothy St Columbus, GA 31907
Eastern Columbus NeighborhoodEstimated Value: $109,000 - $141,760
4
Beds
3
Baths
1,314
Sq Ft
$98/Sq Ft
Est. Value
About This Home
This home is located at 4523 Timothy St, Columbus, GA 31907 and is currently estimated at $128,920, approximately $98 per square foot. 4523 Timothy St is a home located in Muscogee County with nearby schools including St. Mary's Road Magnet Academy, Rothschild Leadership Academy, and Kendrick High School.
Ownership History
Date
Name
Owned For
Owner Type
Purchase Details
Closed on
Jan 19, 2018
Sold by
Rac Properties Of Athens I
Bought by
Broadview Sfga X Llc
Current Estimated Value
Purchase Details
Closed on
Dec 8, 2017
Sold by
Wells Fargo Bank
Bought by
Rac Properties Of Athens Inc
Purchase Details
Closed on
Nov 7, 2017
Sold by
Smith Ricky
Bought by
Wells Fargo Bank Na
Purchase Details
Closed on
Aug 30, 2010
Sold by
Ericson Dennis
Bought by
Smith Ricky and Smith Carol
Home Financials for this Owner
Home Financials are based on the most recent Mortgage that was taken out on this home.
Original Mortgage
$98,057
Interest Rate
4.59%
Mortgage Type
FHA
Purchase Details
Closed on
Dec 29, 2006
Sold by
Wells Fargo Bank Minnesota Na
Bought by
Ericson Dennis
Purchase Details
Closed on
Aug 1, 2006
Sold by
Broadrick Anne L
Bought by
Wells Fargo Bank Minnesota Na
Create a Home Valuation Report for This Property
The Home Valuation Report is an in-depth analysis detailing your home's value as well as a comparison with similar homes in the area
Home Values in the Area
Average Home Value in this Area
Purchase History
| Date | Buyer | Sale Price | Title Company |
|---|---|---|---|
| Broadview Sfga X Llc | $38,000 | -- | |
| Rac Properties Of Athens Inc | $21,600 | -- | |
| Wells Fargo Bank Na | $20,790 | -- | |
| Smith Ricky | $99,900 | None Available | |
| Ericson Dennis | $60,500 | None Available | |
| Wells Fargo Bank Minnesota Na | $45,183 | None Available |
Source: Public Records
Mortgage History
| Date | Status | Borrower | Loan Amount |
|---|---|---|---|
| Previous Owner | Smith Ricky | $98,057 |
Source: Public Records
Tax History Compared to Growth
Tax History
| Year | Tax Paid | Tax Assessment Tax Assessment Total Assessment is a certain percentage of the fair market value that is determined by local assessors to be the total taxable value of land and additions on the property. | Land | Improvement |
|---|---|---|---|---|
| 2025 | $1,321 | $33,756 | $5,976 | $27,780 |
| 2024 | $1,321 | $33,756 | $5,976 | $27,780 |
| 2023 | $1,330 | $33,756 | $5,976 | $27,780 |
| 2022 | $1,035 | $25,344 | $5,976 | $19,368 |
| 2021 | $427 | $10,448 | $5,976 | $4,472 |
| 2020 | $427 | $10,448 | $5,976 | $4,472 |
| 2019 | $428 | $10,448 | $5,976 | $4,472 |
| 2018 | $354 | $8,640 | $1,880 | $6,760 |
| 2017 | $1,120 | $27,244 | $5,976 | $21,268 |
| 2016 | $1,639 | $39,725 | $3,679 | $36,046 |
| 2015 | $1,641 | $39,725 | $3,679 | $36,046 |
| 2014 | $1,643 | $39,725 | $3,679 | $36,046 |
| 2013 | -- | $39,725 | $3,679 | $36,046 |
Source: Public Records
Map
Nearby Homes
- 4534 Sentry St
- 4414 Curry St
- 392 Olsen Ave
- 4516 Sims St
- 4422 Pate Dr
- 391 & 401 Victoria Dr
- 4801 Allen St
- 410 McCartha Dr
- 4846 Maplewood Dr
- 418 Henson Ave
- 4437 St Marys Rd
- 5003 Shirley Ann Dr
- 4145 Braddock Dr
- 5021 Shirley Ann Dr
- 4930 Capricorn Ct
- 59 Apollo Dr
- 533 Englewood Dr
- 4459 Bermuda St
- 636 Dogwood Dr
- 4917 Brightstar Ln
- 4517 Timothy St
- 4535 Timothy St
- 4526 Estonia St
- 4513 Timothy St
- 4532 Estonia St
- 4518 Estonia St
- 210 Braselman Ave
- 228 Braselman Ave
- 4524 Timothy St
- 4538 Estonia St
- 4541 Timothy St
- 4530 Timothy St
- 4536 Timothy St
- 206 Braselman Ave
- 4550 Estonia St
- 234 Braselman Ave
- 4547 Timothy St
- 4544 Timothy St
- 217 Braselman Ave
- 4525 Sentry St