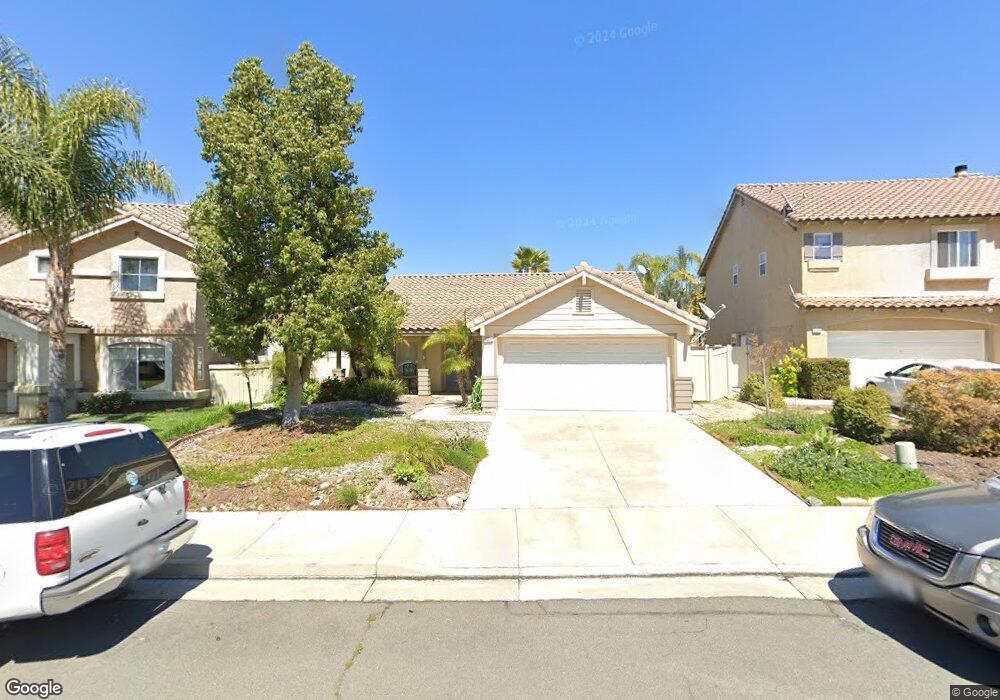
45232 Corte Progresso Temecula, CA 92592
Redhawk NeighborhoodEstimated Value: $607,528 - $655,000
4
Beds
2
Baths
1,600
Sq Ft
$397/Sq Ft
Est. Value
About This Home
This home is located at 45232 Corte Progresso, Temecula, CA 92592 and is currently estimated at $635,132, approximately $396 per square foot. 45232 Corte Progresso is a home located in Riverside County with nearby schools including Red Hawk Elementary, Erle Stanley Gardner Middle School, and Great Oak High School.
Ownership History
Date
Name
Owned For
Owner Type
Purchase Details
Closed on
Feb 27, 2025
Sold by
Tyree Ian J
Bought by
Tyree Patricia Revocable Living Trust
Current Estimated Value
Purchase Details
Closed on
Oct 23, 2019
Sold by
Tyree Patricia Foley and Tyree Patricia J
Bought by
Tyree Patricia Foley and Revocable Livin Patricia Tyree
Purchase Details
Closed on
Jun 26, 2003
Sold by
Yaptangco Michael V
Bought by
Tyree Ian J and Tyree Patricia J
Home Financials for this Owner
Home Financials are based on the most recent Mortgage that was taken out on this home.
Original Mortgage
$206,250
Interest Rate
5.13%
Mortgage Type
Purchase Money Mortgage
Purchase Details
Closed on
Aug 4, 1998
Sold by
Overland Redhawk Llc
Bought by
Yaptangco Michael
Home Financials for this Owner
Home Financials are based on the most recent Mortgage that was taken out on this home.
Original Mortgage
$151,407
Interest Rate
6.88%
Mortgage Type
FHA
Create a Home Valuation Report for This Property
The Home Valuation Report is an in-depth analysis detailing your home's value as well as a comparison with similar homes in the area
Home Values in the Area
Average Home Value in this Area
Purchase History
| Date | Buyer | Sale Price | Title Company |
|---|---|---|---|
| Tyree Patricia Revocable Living Trust | -- | None Listed On Document | |
| Tyree Patricia Foley | -- | None Available | |
| Tyree Ian J | $275,000 | First American Title Co | |
| Yaptangco Michael | $155,000 | First American Title Ins Co |
Source: Public Records
Mortgage History
| Date | Status | Borrower | Loan Amount |
|---|---|---|---|
| Previous Owner | Tyree Ian J | $206,250 | |
| Previous Owner | Yaptangco Michael | $151,407 |
Source: Public Records
Tax History
| Year | Tax Paid | Tax Assessment Tax Assessment Total Assessment is a certain percentage of the fair market value that is determined by local assessors to be the total taxable value of land and additions on the property. | Land | Improvement |
|---|---|---|---|---|
| 2025 | $5,222 | $390,966 | $113,730 | $277,236 |
| 2023 | $5,222 | $375,785 | $109,314 | $266,471 |
| 2022 | $5,053 | $368,418 | $107,171 | $261,247 |
| 2021 | $4,946 | $361,195 | $105,070 | $256,125 |
| 2020 | $4,880 | $357,492 | $103,993 | $253,499 |
| 2019 | $4,812 | $350,483 | $101,954 | $248,529 |
| 2018 | $4,715 | $343,611 | $99,956 | $243,655 |
| 2017 | $4,629 | $336,875 | $97,997 | $238,878 |
| 2016 | $4,540 | $330,271 | $96,076 | $234,195 |
| 2015 | $4,307 | $312,000 | $91,000 | $221,000 |
| 2014 | $4,236 | $311,000 | $90,000 | $221,000 |
Source: Public Records
Map
Nearby Homes
- 45371 Corte Progreso
- 31868 Corte Montoya
- 32038 Corte Eldorado
- 31725 Via Cordoba
- 45418 Seagull Way
- 32122 Corte Eldorado
- 45043 Corte Alegra
- 31545 Via Cordoba
- 31687 Via San Carlos
- 45511 Seagull Way
- 45495 Peacock Place
- 32153 Caminito Osuna
- 45062 Corte Bella Donna
- 45632 Corte Lobos
- 31935 Bitterroot Ct
- 45433 Vista Verde
- 45360 Vista Verde
- 44681 Arbor Ln
- 45754 Corte Lerma
- 45540 Via Jaca
- 45244 Corte Progresso
- 45220 Corte Progresso
- 45220 Corte Progreso
- 31887 Via Saltio
- 45256 Corte Progreso
- 45256 Corte Progresso
- 45208 Corte Progresso
- 45208 Corte Progreso
- 31875 Via Saltio
- 31899 Via Saltio
- 45237 Corte Progresso
- 45268 Corte Progreso
- 31911 Via Saltio
- 45215 Corte Progresso
- 45196 Corte Progresso
- 45268 Corte Progresso
- 45251 Corte Progresso
- 45280 Corte Progreso
- 45201 Corte Progresso
- 31851 Via Saltio
Your Personal Tour Guide
Ask me questions while you tour the home.