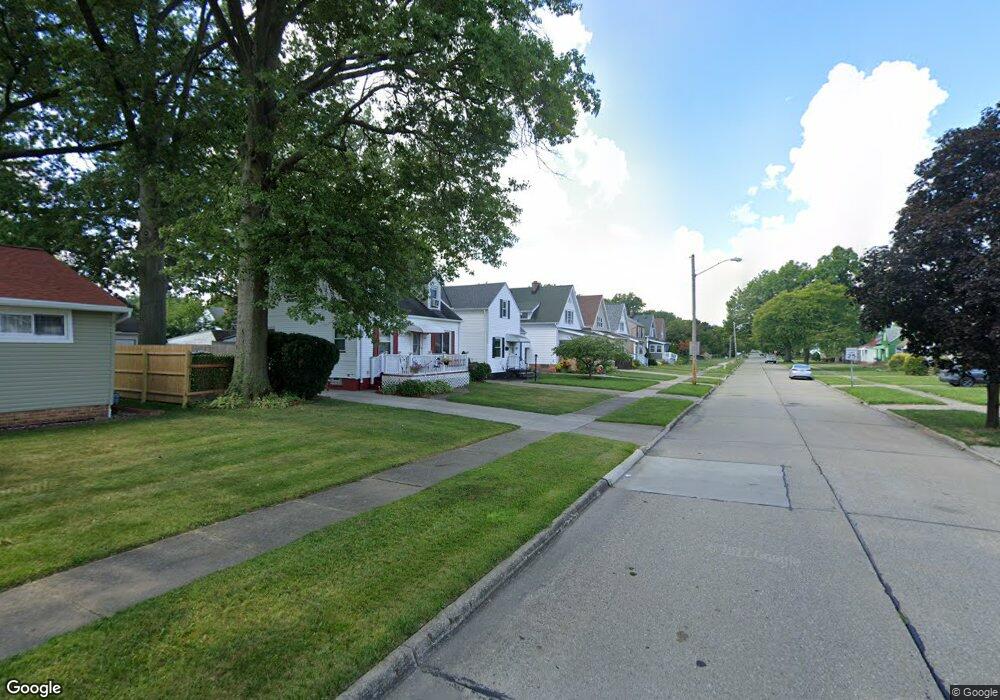
4525 Kenmore Ave Cleveland, OH 44134
Estimated Value: $178,000 - $189,000
3
Beds
1
Bath
1,034
Sq Ft
$178/Sq Ft
Est. Value
About This Home
This home is located at 4525 Kenmore Ave, Cleveland, OH 44134 and is currently estimated at $184,242, approximately $178 per square foot. 4525 Kenmore Ave is a home located in Cuyahoga County with nearby schools including Thoreau Park Elementary School, Shiloh Middle School, and Parma High School.
Ownership History
Date
Name
Owned For
Owner Type
Purchase Details
Closed on
Jul 14, 1998
Sold by
Stephens Jack and Hook Goldie M
Bought by
Gould Robert B and Newcomer Leslie H
Current Estimated Value
Home Financials for this Owner
Home Financials are based on the most recent Mortgage that was taken out on this home.
Original Mortgage
$79,000
Outstanding Balance
$16,378
Interest Rate
7.15%
Estimated Equity
$167,864
Purchase Details
Closed on
May 8, 1998
Sold by
Estate Of Don E Stephens
Bought by
Stephens Marlene J
Purchase Details
Closed on
Dec 5, 1991
Sold by
Stephens Martha E
Bought by
Stephens Martha E
Purchase Details
Closed on
Feb 5, 1982
Sold by
Andrew J Stephens
Bought by
Stephens Martha E
Purchase Details
Closed on
Dec 19, 1978
Sold by
Stephens Andrew J and M E
Bought by
Andrew J Stephens
Purchase Details
Closed on
Jan 1, 1975
Bought by
Stephens Andrew J and M E
Create a Home Valuation Report for This Property
The Home Valuation Report is an in-depth analysis detailing your home's value as well as a comparison with similar homes in the area
Home Values in the Area
Average Home Value in this Area
Purchase History
| Date | Buyer | Sale Price | Title Company |
|---|---|---|---|
| Gould Robert B | $93,000 | Transcounty Title Agency Inc | |
| Stephens Marlene J | -- | -- | |
| Stephens Martha E | -- | -- | |
| Stephens Martha E | -- | -- | |
| Andrew J Stephens | -- | -- | |
| Stephens Andrew J | -- | -- |
Source: Public Records
Mortgage History
| Date | Status | Borrower | Loan Amount |
|---|---|---|---|
| Open | Gould Robert B | $79,000 |
Source: Public Records
Tax History Compared to Growth
Tax History
| Year | Tax Paid | Tax Assessment Tax Assessment Total Assessment is a certain percentage of the fair market value that is determined by local assessors to be the total taxable value of land and additions on the property. | Land | Improvement |
|---|---|---|---|---|
| 2024 | $3,257 | $53,375 | $9,870 | $43,505 |
| 2023 | $2,835 | $39,730 | $7,600 | $32,130 |
| 2022 | $2,808 | $39,730 | $7,600 | $32,130 |
| 2021 | $2,887 | $39,730 | $7,600 | $32,130 |
| 2020 | $2,529 | $30,560 | $5,850 | $24,710 |
| 2019 | $2,418 | $87,300 | $16,700 | $70,600 |
| 2018 | $2,433 | $30,560 | $5,850 | $24,710 |
| 2017 | $2,297 | $26,850 | $4,690 | $22,160 |
| 2016 | $2,283 | $26,850 | $4,690 | $22,160 |
| 2015 | $2,171 | $26,850 | $4,690 | $22,160 |
| 2014 | $2,171 | $27,410 | $4,800 | $22,610 |
Source: Public Records
Map
Nearby Homes
- 4420 Torrington Ave
- 4409 Milford Ave
- 5521 W 48th St
- 4005 Pershing Ave
- 3910 Wood Ave
- 5000 Torrington Ave
- 4000 Pershing Ave
- 5212 Wood Ave
- 3710 Wood Ave
- 4424 Forestwood Dr
- 4323 Russell Ave
- 5432 State Rd
- 4910 Russell Ave
- 5815 Westlake Ave
- 5914 Forest Ave
- 4915 Tuxedo Ave
- 4439 Woodway Ave
- 3714 Russell Ave
- 4212 Tuxedo Ave
- 6021 Snow Rd
- 4529 Kenmore Ave
- 4521 Kenmore Ave
- 4601 Kenmore Ave
- 4517 Kenmore Ave
- 4603 Kenmore Ave
- 4524 Krueger Ave
- 4520 Krueger Ave
- 4607 Kenmore Ave
- 4528 Krueger Ave
- 4518 Krueger Ave
- 4511 Kenmore Ave
- 4602 Krueger Ave
- 4514 Krueger Ave
- 4528 Kenmore Ave
- 4520 Kenmore Ave
- 4609 Kenmore Ave
- 4600 Kenmore Ave
- 4518 Kenmore Ave
- 4507 Kenmore Ave
- 4606 Krueger Ave