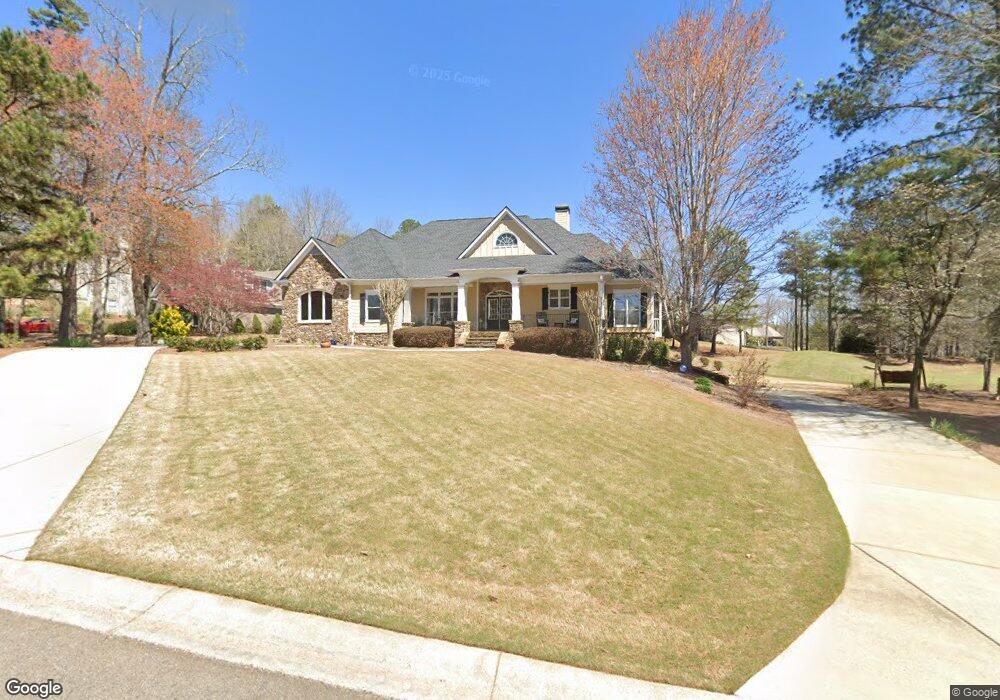
4525 Knightsbridge Rd Flowery Branch, GA 30542
Royal Lakes NeighborhoodEstimated Value: $744,968 - $1,063,000
4
Beds
4
Baths
3,636
Sq Ft
$240/Sq Ft
Est. Value
About This Home
This home is located at 4525 Knightsbridge Rd, Flowery Branch, GA 30542 and is currently estimated at $873,492, approximately $240 per square foot. 4525 Knightsbridge Rd is a home located in Hall County with nearby schools including Chicopee Elementary School, South Hall Middle School, and Johnson High School.
Ownership History
Date
Name
Owned For
Owner Type
Purchase Details
Closed on
Aug 15, 2011
Sold by
Kent Shannon Patrick
Bought by
Howe James C and Howe Michelle R
Current Estimated Value
Home Financials for this Owner
Home Financials are based on the most recent Mortgage that was taken out on this home.
Original Mortgage
$337,500
Outstanding Balance
$233,354
Interest Rate
4.54%
Mortgage Type
New Conventional
Estimated Equity
$640,138
Purchase Details
Closed on
Apr 20, 2004
Sold by
Whitmire Homes Inc
Bought by
Kent Shannon Patrick and Kent Jill
Home Financials for this Owner
Home Financials are based on the most recent Mortgage that was taken out on this home.
Original Mortgage
$371,250
Interest Rate
4.88%
Mortgage Type
New Conventional
Purchase Details
Closed on
Sep 16, 2002
Sold by
Royal Lakes Ltd Llc
Bought by
Whitmire Homes Inc
Purchase Details
Closed on
May 15, 2002
Sold by
Royals Lakes Associates Lp
Bought by
Royal Lakes Ltd Llc
Create a Home Valuation Report for This Property
The Home Valuation Report is an in-depth analysis detailing your home's value as well as a comparison with similar homes in the area
Home Values in the Area
Average Home Value in this Area
Purchase History
| Date | Buyer | Sale Price | Title Company |
|---|---|---|---|
| Howe James C | $375,000 | -- | |
| Kent Shannon Patrick | $495,000 | -- | |
| Whitmire Homes Inc | $98,000 | -- | |
| Royal Lakes Ltd Llc | $6,200,000 | -- |
Source: Public Records
Mortgage History
| Date | Status | Borrower | Loan Amount |
|---|---|---|---|
| Open | Howe James C | $337,500 | |
| Previous Owner | Kent Shannon Patrick | $371,250 |
Source: Public Records
Tax History Compared to Growth
Tax History
| Year | Tax Paid | Tax Assessment Tax Assessment Total Assessment is a certain percentage of the fair market value that is determined by local assessors to be the total taxable value of land and additions on the property. | Land | Improvement |
|---|---|---|---|---|
| 2024 | $8,062 | $322,440 | $51,000 | $271,440 |
| 2023 | $6,651 | $281,000 | $38,920 | $242,080 |
| 2022 | $6,341 | $240,560 | $28,120 | $212,440 |
| 2021 | $5,624 | $208,680 | $22,960 | $185,720 |
| 2020 | $5,605 | $201,960 | $22,960 | $179,000 |
| 2019 | $5,813 | $207,800 | $35,360 | $172,440 |
| 2018 | $6,066 | $210,040 | $27,200 | $182,840 |
| 2017 | $5,666 | $198,160 | $27,240 | $170,920 |
| 2016 | $4,797 | $171,200 | $27,240 | $143,960 |
| 2015 | $4,836 | $171,360 | $27,240 | $144,120 |
| 2014 | $4,836 | $171,360 | $27,240 | $144,120 |
Source: Public Records
Map
Nearby Homes
- 4621 Chartwell Chase Ct
- 0 Marble Arch Way
- 4315 Marble Arch Way
- 4135 Ashford Way
- 4478 Longmead Rd
- 4439 Oxburgh Park
- 4434 Oxburgh Park
- 3927 Celtic Ct
- 4610 Blakeford Ct
- 4234 Quail Creek Dr
- 4211 Quail Creek Dr
- 4226 Quail Creek Dr
- 4835 Upper Berkshire Rd
- 3969 Bolding Rd
- 4708 Upper Berkshire Rd Unit 39
- 2460 Calvary Church Rd
- 3929 Perry Ln
- 4519 Knightsbridge Rd
- 4515 Knightsbridge Rd
- 0 Knightsbridge Rd Unit 8990880
- 0 Knightsbridge Rd Unit 8976412
- 0 Knightsbridge Rd Unit 8133531
- 0 Knightsbridge Rd
- 4632 Chartwell Chase Ct
- 4518 Knightsbridge Rd
- 4628 Chartwell Chase Ct
- 4511 Knightsbridge Rd
- 4527 Warwick Glen Place
- 4514 Knightsbridge Rd
- 4622 Chartwell Chase Ct
- 0 Warwick Glen Place Unit 7577767
- 0 Warwick Glen Place Unit 8403338
- 0 Warwick Glen Place
- 4522 Warwick Glen Place
- 4614 Chartwell Chase Ct
- 4637 Chartwell Chase Ct
- 4322 Park Royal Dr