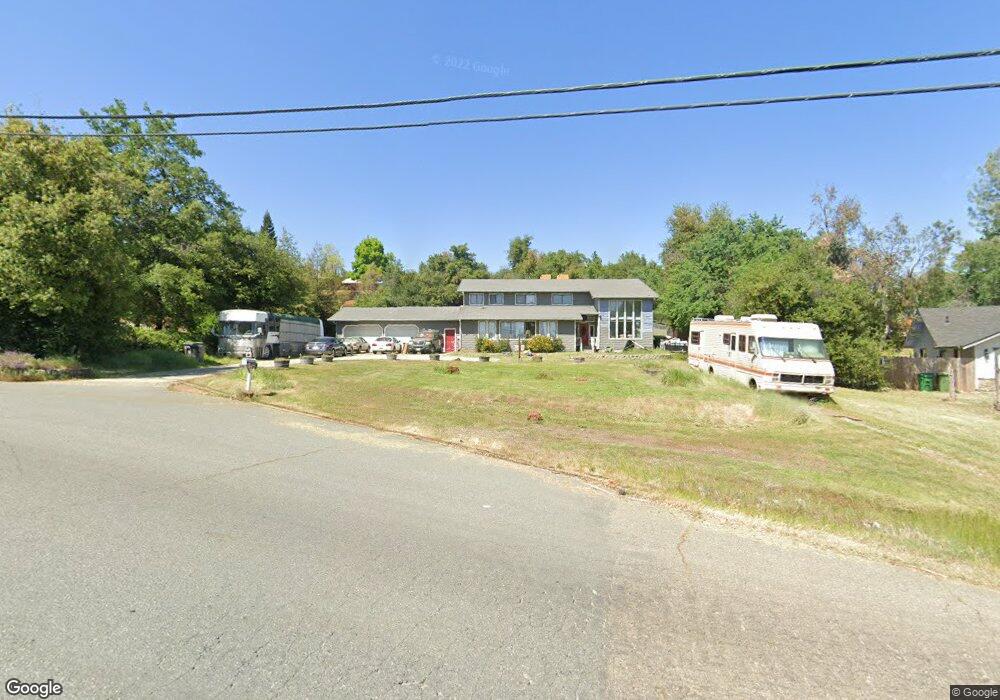
4525 Trinity St Shasta Lake, CA 96019
Pine Grove NeighborhoodEstimated Value: $451,000 - $613,000
5
Beds
3
Baths
3,723
Sq Ft
$145/Sq Ft
Est. Value
About This Home
This home is located at 4525 Trinity St, Shasta Lake, CA 96019 and is currently estimated at $540,856, approximately $145 per square foot. 4525 Trinity St is a home located in Shasta County with nearby schools including Redding STEM Academy and Rocky Point Charter School.
Ownership History
Date
Name
Owned For
Owner Type
Purchase Details
Closed on
Aug 24, 2019
Sold by
Duryee Larry A
Bought by
Duryee Larry A and Vargas Leigh A
Current Estimated Value
Purchase Details
Closed on
Aug 4, 2005
Sold by
Duryee Larry A
Bought by
Duryee Larry A and Duryee Georgana
Home Financials for this Owner
Home Financials are based on the most recent Mortgage that was taken out on this home.
Original Mortgage
$290,500
Outstanding Balance
$150,539
Interest Rate
5.45%
Mortgage Type
New Conventional
Estimated Equity
$390,317
Purchase Details
Closed on
Apr 24, 1997
Sold by
Azizollah Barzin and Azizollah Alene
Bought by
Duryee Larry A and Duryee Georgana
Home Financials for this Owner
Home Financials are based on the most recent Mortgage that was taken out on this home.
Original Mortgage
$135,750
Interest Rate
9.5%
Create a Home Valuation Report for This Property
The Home Valuation Report is an in-depth analysis detailing your home's value as well as a comparison with similar homes in the area
Home Values in the Area
Average Home Value in this Area
Purchase History
| Date | Buyer | Sale Price | Title Company |
|---|---|---|---|
| Duryee Larry A | -- | None Available | |
| Duryee Larry A | -- | Fidelity National Title | |
| Duryee Larry A | -- | Fidelity National Title | |
| Duryee Larry A | $181,000 | First American Title Co |
Source: Public Records
Mortgage History
| Date | Status | Borrower | Loan Amount |
|---|---|---|---|
| Open | Duryee Larry A | $290,500 | |
| Closed | Duryee Larry A | $135,750 | |
| Closed | Duryee Larry A | $45,250 |
Source: Public Records
Tax History Compared to Growth
Tax History
| Year | Tax Paid | Tax Assessment Tax Assessment Total Assessment is a certain percentage of the fair market value that is determined by local assessors to be the total taxable value of land and additions on the property. | Land | Improvement |
|---|---|---|---|---|
| 2025 | $3,114 | $294,754 | $65,129 | $229,625 |
| 2024 | $3,053 | $288,975 | $63,852 | $225,123 |
| 2023 | $3,053 | $283,309 | $62,600 | $220,709 |
| 2022 | $2,970 | $277,755 | $61,373 | $216,382 |
| 2021 | $2,930 | $272,310 | $60,170 | $212,140 |
| 2020 | $2,918 | $269,519 | $59,554 | $209,965 |
| 2019 | $2,827 | $264,236 | $58,387 | $205,849 |
| 2018 | $2,826 | $259,056 | $57,243 | $201,813 |
| 2017 | $2,779 | $253,977 | $56,121 | $197,856 |
| 2016 | $2,657 | $248,998 | $55,021 | $193,977 |
| 2015 | $2,614 | $245,259 | $54,195 | $191,064 |
| 2014 | $2,635 | $240,456 | $53,134 | $187,322 |
Source: Public Records
Map
Nearby Homes
- 3097 Butterfly Ln
- 4620 Orkney Place Unit 3
- 3202 Dartford Dr
- 3134 West St
- 3257 Sioux Dr
- 3220 Wandsworth Dr
- 4399 Newbury Ct
- 4145 Doyle Ct
- 0 Avington Way
- 3126 Chaucer Way
- 2319 Ostling Ave
- 3460 Tomahawk Trail
- 5295 Pine Grove Ave
- 4200 Pine Grove Ave
- 2495 Farm Hill Dr
- 2141 Montana Ave
- NSA Coeur d Alene Ave
- 3825 Coeur d Alene Ave
- 3742 Craftsman Ave
- 3703 Craftsman Ave
- 4539 Trinity St
- 0 Trinity St
- 4505 Trinity St
- 4448 Hillington Ct
- 4510 Trinity St
- 4497 Trinity St
- 4456 Hillington Ct
- 4436 Hillington Ct
- 4545 Trinity St
- 4496 Trinity St
- 3043 Butterfly Ln
- 4464 Hillington Ct
- 3043 Butterfly
- 4424 Hillington Ct
- 4530 Trinity St
- 4472 Trinity St
- 4447 Hillington Ct
- 4540 Trinity St
- 2948 Sioux Dr
- 3075 Butterfly Ln