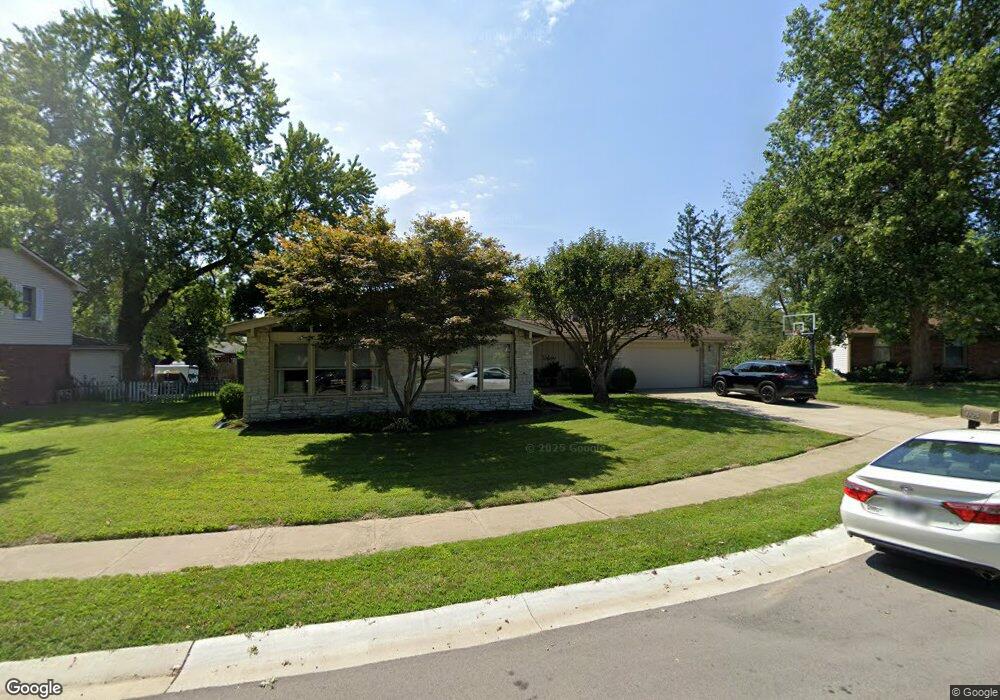
4525 Woodcrest Dr Columbus, IN 47203
Estimated Value: $288,130 - $300,000
3
Beds
2
Baths
1,745
Sq Ft
$169/Sq Ft
Est. Value
About This Home
This home is located at 4525 Woodcrest Dr, Columbus, IN 47203 and is currently estimated at $295,283, approximately $169 per square foot. 4525 Woodcrest Dr is a home located in Bartholomew County with nearby schools including W.D. Richards Elementary School, Central Middle School, and Columbus East High School.
Ownership History
Date
Name
Owned For
Owner Type
Purchase Details
Closed on
Aug 6, 2020
Sold by
Cantu Larry M and Cantu Kristen L
Bought by
Cantu Larry M and Cantu Kristen L
Current Estimated Value
Purchase Details
Closed on
Sep 30, 2014
Sold by
Dunville Brennan L and Dunville Shelby L
Bought by
Cantu Larry M and Pearson Kristen
Purchase Details
Closed on
Feb 27, 2008
Sold by
Eversman Brian L
Bought by
Dunville Brennan L and Dunville Shelby L
Purchase Details
Closed on
Jun 28, 2006
Sold by
Fannie Mae
Bought by
Eversman Brian L
Purchase Details
Closed on
Jan 19, 2006
Sold by
Thompson Jeannie A
Bought by
Federal National Mortgage Association
Purchase Details
Closed on
May 8, 2001
Sold by
Thompson Rob D and Thompson Jeannie A
Bought by
Thompson Jeannie A
Purchase Details
Closed on
Jun 1, 1998
Sold by
Ronsheim Stephen E and Ronsheim Andrea L
Bought by
Thompson Rob D
Create a Home Valuation Report for This Property
The Home Valuation Report is an in-depth analysis detailing your home's value as well as a comparison with similar homes in the area
Home Values in the Area
Average Home Value in this Area
Purchase History
| Date | Buyer | Sale Price | Title Company |
|---|---|---|---|
| Cantu Larry M | -- | None Available | |
| Cantu Larry M | $167,000 | Stewart Title Co | |
| Cantu Larry M | -- | Attorney | |
| Dunville Brennan L | -- | Attorney | |
| Eversman Brian L | -- | None Available | |
| Federal National Mortgage Association | -- | None Available | |
| Thompson Jeannie A | -- | -- | |
| Thompson Rob D | $127,000 | -- |
Source: Public Records
Tax History Compared to Growth
Tax History
| Year | Tax Paid | Tax Assessment Tax Assessment Total Assessment is a certain percentage of the fair market value that is determined by local assessors to be the total taxable value of land and additions on the property. | Land | Improvement |
|---|---|---|---|---|
| 2024 | $2,570 | $228,900 | $44,300 | $184,600 |
| 2023 | $2,755 | $231,300 | $44,300 | $187,000 |
| 2022 | $2,258 | $188,100 | $44,300 | $143,800 |
| 2021 | $2,169 | $179,000 | $34,600 | $144,400 |
| 2020 | $1,826 | $149,700 | $34,600 | $115,100 |
| 2019 | $1,812 | $157,900 | $34,600 | $123,300 |
| 2018 | $1,777 | $152,300 | $34,600 | $117,700 |
| 2017 | $1,770 | $152,100 | $30,300 | $121,800 |
| 2016 | $1,614 | $144,000 | $30,300 | $113,700 |
| 2014 | $1,697 | $143,800 | $30,300 | $113,500 |
Source: Public Records
Map
Nearby Homes
- 4515 W Mission Ct
- 3055 Fox Ridge Dr
- 4291 Fairlawn Dr
- 3042 Fairlawn Dr
- 3200 Thomas Trace
- 3206 Thomas Trace
- 3231 Overlook Ct
- 5120 Navajo Ct
- 3335 Marilyn St
- 3923 Windstar Way
- 2811 Poplar Dr
- 2940 Taylor Rd
- 3847 Bonaventure Dr
- 5086 Memphis Ct
- 3532 Shoshonee Dr
- 3632 Windstar Ct
- 2630 Wedgewood Dr
- 3258 Starlite Ct
- 3551 Windstar Ct
- 5737 Lauren Ln
- 4535 Woodcrest Dr
- 4515 Woodcrest Dr
- 4520 W Mission Ct
- 4540 W Mission Ct
- 4510 Woodcrest Dr
- 4530 Woodcrest Dr
- 4545 Woodcrest Dr
- 4540 Woodcrest Dr
- 4520 Woodcrest Dr
- 4550 W Mission Ct
- 4510 W Mission Ct
- 4550 Woodcrest Dr
- 3241 Fairlawn Dr
- 3251 Fairlawn Dr
- 4525 W Mission Ct
- 4610 Woodcrest Dr
- 4535 W Mission Ct
- 3261 Fairlawn Dr
- 4502 W Mission Ct