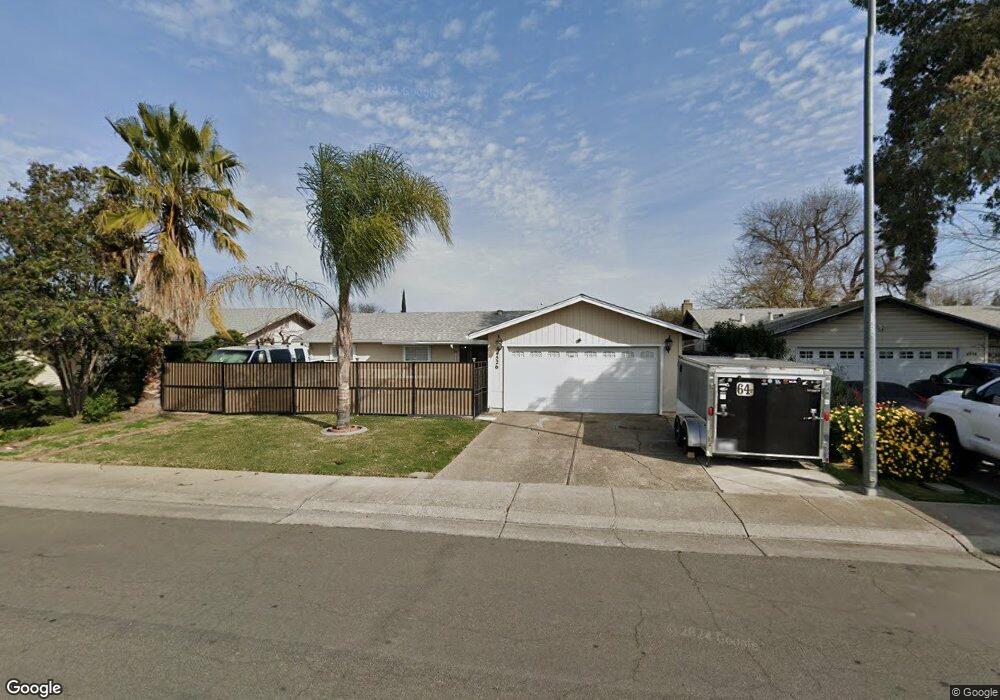
4526 Hemingway Ct Stockton, CA 95207
Lincoln Village NeighborhoodEstimated Value: $281,000 - $425,000
3
Beds
2
Baths
1,524
Sq Ft
$235/Sq Ft
Est. Value
About This Home
This home is located at 4526 Hemingway Ct, Stockton, CA 95207 and is currently estimated at $357,759, approximately $234 per square foot. 4526 Hemingway Ct is a home located in San Joaquin County with nearby schools including Cleveland Elementary School, Wilson Elementary School, and El Dorado Elementary School.
Ownership History
Date
Name
Owned For
Owner Type
Purchase Details
Closed on
Nov 11, 2013
Sold by
Parra Rolando
Bought by
Parra Juana Guadalupe
Current Estimated Value
Home Financials for this Owner
Home Financials are based on the most recent Mortgage that was taken out on this home.
Original Mortgage
$123,076
Outstanding Balance
$91,565
Interest Rate
4.17%
Mortgage Type
FHA
Estimated Equity
$266,194
Purchase Details
Closed on
Mar 28, 2008
Sold by
Parra Maria C
Bought by
Parra Roman G
Home Financials for this Owner
Home Financials are based on the most recent Mortgage that was taken out on this home.
Original Mortgage
$123,200
Interest Rate
6.04%
Mortgage Type
New Conventional
Purchase Details
Closed on
Mar 13, 2008
Sold by
Mount Tai Capital Llc
Bought by
Parra Roman
Home Financials for this Owner
Home Financials are based on the most recent Mortgage that was taken out on this home.
Original Mortgage
$123,200
Interest Rate
6.04%
Mortgage Type
New Conventional
Purchase Details
Closed on
Nov 28, 2007
Sold by
Hsbc Bank Usa Na
Bought by
Mount Tai Capital Inc and Ritz Holdings Llc
Purchase Details
Closed on
Apr 30, 2007
Sold by
Pak Salath
Bought by
Hsbc Bank Usa Na and Peoples Choice Home Loan Securities Tr
Purchase Details
Closed on
Oct 31, 2005
Sold by
Pak Salath
Bought by
Pak Salin and Pak Savanny
Home Financials for this Owner
Home Financials are based on the most recent Mortgage that was taken out on this home.
Original Mortgage
$279,960
Interest Rate
6.6%
Mortgage Type
Fannie Mae Freddie Mac
Purchase Details
Closed on
Sep 2, 2005
Sold by
Lata Suman
Bought by
Pak Salath
Home Financials for this Owner
Home Financials are based on the most recent Mortgage that was taken out on this home.
Original Mortgage
$279,960
Interest Rate
6.6%
Mortgage Type
Fannie Mae Freddie Mac
Purchase Details
Closed on
Mar 29, 2005
Sold by
The Henry Y T Wong & Sylvia S S Wong Fam and Tung Henry Yick
Bought by
Lata Suman
Home Financials for this Owner
Home Financials are based on the most recent Mortgage that was taken out on this home.
Original Mortgage
$245,600
Interest Rate
5.87%
Mortgage Type
New Conventional
Purchase Details
Closed on
Sep 11, 1996
Sold by
Wong Henry Y and Shing Sylvia Sin
Bought by
Wong Henry Yick Tung and Wong Sylvia Sin Shing
Home Financials for this Owner
Home Financials are based on the most recent Mortgage that was taken out on this home.
Original Mortgage
$53,900
Interest Rate
7.88%
Create a Home Valuation Report for This Property
The Home Valuation Report is an in-depth analysis detailing your home's value as well as a comparison with similar homes in the area
Home Values in the Area
Average Home Value in this Area
Purchase History
| Date | Buyer | Sale Price | Title Company |
|---|---|---|---|
| Parra Juana Guadalupe | -- | Chicago Title Company | |
| Parra Juana Guadalupe | $140,000 | Chicago Title Company | |
| Parra Roman G | -- | Chicago Title Company | |
| Parra Roman | $154,000 | None Available | |
| Mount Tai Capital Inc | $133,700 | None Available | |
| Hsbc Bank Usa Na | $221,643 | None Available | |
| Pak Salin | -- | -- | |
| Pak Salath | $350,000 | Placer Title Company | |
| Lata Suman | $307,000 | Placer Title Company | |
| The Oconnor Foundation Of San Joaquin Co | -- | Placer Title Company | |
| Wong Henry Yick Tung | -- | Fidelity National Title Co |
Source: Public Records
Mortgage History
| Date | Status | Borrower | Loan Amount |
|---|---|---|---|
| Open | Parra Juana Guadalupe | $123,076 | |
| Previous Owner | Parra Roman G | $123,200 | |
| Previous Owner | Pak Salath | $279,960 | |
| Previous Owner | Lata Suman | $245,600 | |
| Previous Owner | Wong Henry Yick Tung | $53,900 | |
| Closed | Lata Suman | $46,050 |
Source: Public Records
Tax History Compared to Growth
Tax History
| Year | Tax Paid | Tax Assessment Tax Assessment Total Assessment is a certain percentage of the fair market value that is determined by local assessors to be the total taxable value of land and additions on the property. | Land | Improvement |
|---|---|---|---|---|
| 2025 | $2,246 | $177,742 | $49,031 | $128,711 |
| 2024 | $2,210 | $174,258 | $48,070 | $126,188 |
| 2023 | $2,160 | $170,842 | $47,128 | $123,714 |
| 2022 | $2,101 | $167,493 | $46,204 | $121,289 |
| 2021 | $2,019 | $164,210 | $45,299 | $118,911 |
| 2020 | $2,058 | $162,527 | $44,835 | $117,692 |
| 2019 | $2,050 | $159,341 | $43,956 | $115,385 |
| 2018 | $2,012 | $156,218 | $43,095 | $113,123 |
| 2017 | $1,906 | $153,155 | $42,250 | $110,905 |
| 2016 | $1,941 | $150,152 | $41,421 | $108,731 |
| 2014 | $1,847 | $145,000 | $40,000 | $105,000 |
Source: Public Records
Map
Nearby Homes
- 4463 Townehome Dr
- 4478 Calandria St Unit 4
- 4621 Hillsboro Way
- 4720 Greensboro Way
- 4718 Hillsboro Way
- 4428 Calandria St Unit 4
- 408 E Bianchi Rd Unit 4
- 1120 Willow Oak
- 505 Coventry Dr
- 4419 La Cresta Way Unit 1
- 428 Caribrook Way Unit 3
- 416 Caribrook Way Unit 3
- 422 Caribrook Way Unit 3
- 4465 Dorset St
- 4450 Oakfield Dr
- 4811 Huntington Ln
- The Discovery Plan at Calaveras Place
- 908 Terranova Ct
- 705 Spirou St
- 4235 Alvarado Ave
- 4518 Hemingway Ct
- 4534 Hemingway Ct
- 4527 Greensboro Way
- 4529 Greensboro Way
- 4535 Greensboro Way
- 4519 Greensboro Way
- 4510 Hemingway Ct
- 4542 Hemingway Ct
- 820 Hemingway Dr
- 4601 Greensboro Way
- 4511 Greensboro Way
- 4525 Hemingway Ct
- 4533 Hemingway Ct
- 4517 Hemingway Ct
- 4609 Greensboro Way
- 4541 Hemingway Ct
- 4502 Hemingway Ct
- 4503 Greensboro Way
- 718 Hemingway Dr
- 4509 Hemingway Ct