4527 S Drexel Blvd Unit 45273N Chicago, IL 60653
Kenwood NeighborhoodEstimated Value: $141,000 - $191,000
2
Beds
2
Baths
900
Sq Ft
$181/Sq Ft
Est. Value
About This Home
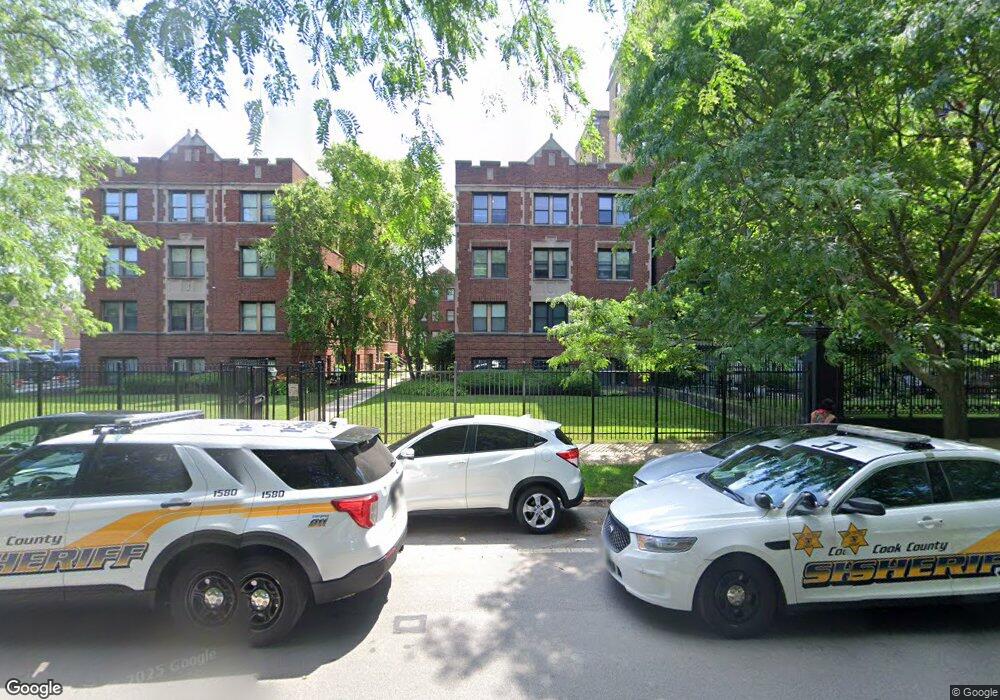
This home is located at 4527 S Drexel Blvd Unit 45273N, Chicago, IL 60653 and is currently estimated at $162,892, approximately $180 per square foot. 4527 S Drexel Blvd Unit 45273N is a home located in Cook County with nearby schools including Woodson South Elementary School, Robinson Elementary School, and The UChicago Charter School - North Kenwood/Oakland.
Ownership History
Date
Name
Owned For
Owner Type
Purchase Details
Closed on
Oct 27, 2021
Sold by
Walls Derrell L
Bought by
D Mroz Properties Llc
Current Estimated Value
Purchase Details
Closed on
Dec 17, 2008
Sold by
The Bank Of New York Mellon Trust Compan
Bought by
Walls Derrell L
Home Financials for this Owner
Home Financials are based on the most recent Mortgage that was taken out on this home.
Original Mortgage
$69,451
Interest Rate
5.08%
Mortgage Type
FHA
Purchase Details
Closed on
Apr 2, 2007
Sold by
Coleman Laraine E
Bought by
The Bank Of New York Trust Co Na and Jp Morgan Chase Bank Na
Purchase Details
Closed on
Jun 15, 2000
Sold by
Lemurian Condominium Assn Llc
Bought by
Coleman Laraine E
Home Financials for this Owner
Home Financials are based on the most recent Mortgage that was taken out on this home.
Original Mortgage
$120,050
Interest Rate
8.56%
Create a Home Valuation Report for This Property
The Home Valuation Report is an in-depth analysis detailing your home's value as well as a comparison with similar homes in the area
Home Values in the Area
Average Home Value in this Area
Purchase History
| Date | Buyer | Sale Price | Title Company |
|---|---|---|---|
| D Mroz Properties Llc | $53,000 | Chicago Title | |
| Walls Derrell L | $70,000 | First American | |
| The Bank Of New York Trust Co Na | -- | None Available | |
| Coleman Laraine E | $127,000 | -- |
Source: Public Records
Mortgage History
| Date | Status | Borrower | Loan Amount |
|---|---|---|---|
| Previous Owner | Walls Derrell L | $69,451 | |
| Previous Owner | Coleman Laraine E | $120,050 |
Source: Public Records
Tax History Compared to Growth
Tax History
| Year | Tax Paid | Tax Assessment Tax Assessment Total Assessment is a certain percentage of the fair market value that is determined by local assessors to be the total taxable value of land and additions on the property. | Land | Improvement |
|---|---|---|---|---|
| 2024 | $1,376 | $11,533 | $2,162 | $9,371 |
| 2023 | $1,337 | $6,500 | $2,161 | $4,339 |
| 2022 | $1,337 | $6,500 | $2,161 | $4,339 |
| 2021 | $637 | $6,499 | $2,160 | $4,339 |
| 2020 | $288 | $4,397 | $1,049 | $3,348 |
| 2019 | $285 | $4,847 | $1,049 | $3,798 |
| 2018 | $279 | $4,847 | $1,049 | $3,798 |
| 2017 | $380 | $5,141 | $864 | $4,277 |
| 2016 | $530 | $5,141 | $864 | $4,277 |
| 2015 | $461 | $5,141 | $864 | $4,277 |
| 2014 | $627 | $5,950 | $741 | $5,209 |
| 2013 | $604 | $5,950 | $741 | $5,209 |
Source: Public Records
Map
Nearby Homes
- 4527 S Drexel Blvd Unit 1W
- 4529 S Drexel Blvd Unit 452912
- 4537 S Drexel Blvd Unit 706
- 928 E 46th St
- 4553 S Ellis Ave
- 834 E 45th St
- 4446 S Drexel Blvd Unit B
- 4444 S Berkeley Ave
- 4453 S Berkeley Ave Unit 1
- 4523.5 S Drexel Blvd Unit 3W
- 4458 S Greenwood Ave Unit 1E
- 4546 S Cottage Grove Ave
- 4343 S Ellis Ave
- 4537 S Evans Ave
- 4635 S Greenwood Ave
- 4328 S Berkeley Ave
- 4740 S Ingleside Ave Unit 2N
- 1150 E 46th St
- 4529.5 S Drexel Blvd Unit 2W
- 4529.5 S Drexel Blvd Unit 3E
- 4527 S Drexel Blvd Unit 45273W
- 4527 S Drexel Blvd Unit 45272S
- 4527 S Drexel Blvd Unit 45271N
- 4527 S Drexel Blvd Unit 45273S
- 4527 S Drexel Blvd Unit 45271S
- 4527 S Drexel Blvd Unit 45272N
- 4527 S Drexel Blvd Unit 45272W
- 4527 S Drexel Blvd Unit 45271W
- 4527 S Drexel Blvd Unit 1N
- 4527 S Drexel Blvd Unit 2N
- 4527 S Drexel Blvd Unit 1
- 4527 S Drexel Blvd Unit 3N
- 4527 S Drexel Blvd
- 4527 S Drexel Blvd Unit 1S
- 4529 S Drexel Blvd Unit 45292E
- 4529 S Drexel Blvd Unit 452912
- 4529 S Drexel Blvd Unit 45291E
- 4529 S Drexel Blvd Unit 45292W
- 4529 S Drexel Blvd Unit 45293E
- 4529 S Drexel Blvd Unit 45293W