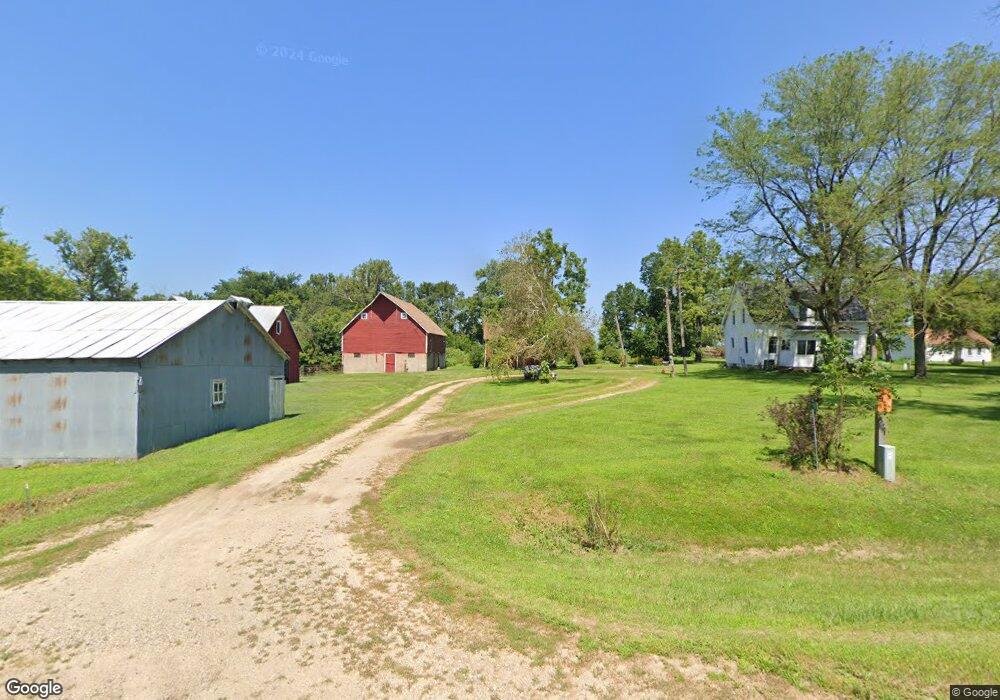
45283 230th St Delavan, MN 56023
Estimated Value: $169,000 - $338,000
3
Beds
1
Bath
1,242
Sq Ft
$177/Sq Ft
Est. Value
About This Home
This home is located at 45283 230th St, Delavan, MN 56023 and is currently estimated at $219,874, approximately $177 per square foot. 45283 230th St is a home located in Faribault County with nearby schools including Blue Earth Area High School.
Ownership History
Date
Name
Owned For
Owner Type
Purchase Details
Closed on
Jun 13, 2008
Sold by
Wilson Robert and Possin Joyee
Bought by
Moore Richard and Beenken Betty
Current Estimated Value
Purchase Details
Closed on
Apr 30, 2008
Sold by
Moore Richard and Moore Carol
Bought by
Wilson Georgia and Wilson Robet
Purchase Details
Closed on
Mar 14, 2008
Sold by
Possin Joyce and Possin Delvin
Bought by
Wilson Georgia and Wilson Robert
Purchase Details
Closed on
Mar 13, 2008
Sold by
Grams Florence and Grams Ray
Bought by
Wilson Georgia and Wilson Robert
Create a Home Valuation Report for This Property
The Home Valuation Report is an in-depth analysis detailing your home's value as well as a comparison with similar homes in the area
Home Values in the Area
Average Home Value in this Area
Purchase History
| Date | Buyer | Sale Price | Title Company |
|---|---|---|---|
| Moore Richard | -- | None Available | |
| Wilson Georgia | $10,166 | None Available | |
| Wilson Georgia | -- | None Available | |
| Wilson Georgia | -- | None Available |
Source: Public Records
Tax History Compared to Growth
Tax History
| Year | Tax Paid | Tax Assessment Tax Assessment Total Assessment is a certain percentage of the fair market value that is determined by local assessors to be the total taxable value of land and additions on the property. | Land | Improvement |
|---|---|---|---|---|
| 2025 | $808 | $155,000 | $69,800 | $85,200 |
| 2024 | $684 | $128,700 | $69,900 | $58,800 |
| 2023 | $604 | $106,000 | $47,400 | $58,600 |
| 2022 | $562 | $90,800 | $47,400 | $43,400 |
| 2021 | $508 | $81,700 | $42,400 | $39,300 |
| 2020 | $400 | $77,600 | $42,400 | $35,200 |
| 2019 | $546 | $75,300 | $42,400 | $32,900 |
| 2018 | $434 | $75,300 | $42,400 | $32,900 |
| 2017 | $406 | $76,900 | $42,400 | $34,500 |
| 2015 | $352 | $71,700 | $42,400 | $29,300 |
| 2013 | -- | $74,000 | $42,400 | $31,600 |
Source: Public Records
Map
Nearby Homes