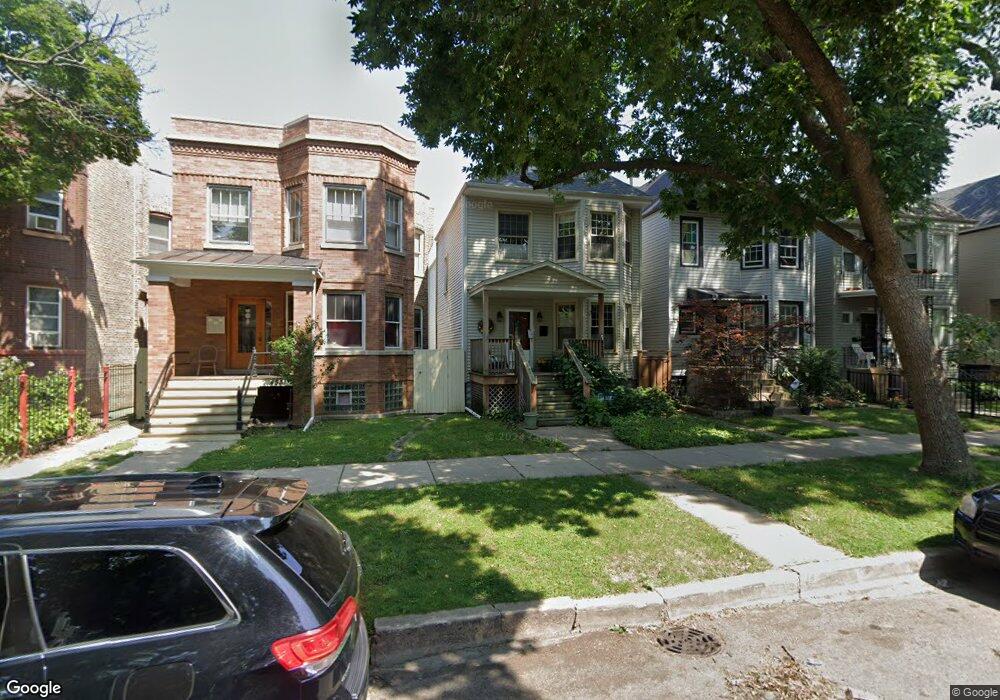
4529 N Drake Ave Chicago, IL 60625
Albany Park NeighborhoodEstimated Value: $614,743 - $832,000
6
Beds
3
Baths
1,801
Sq Ft
$401/Sq Ft
Est. Value
About This Home
This home is located at 4529 N Drake Ave, Chicago, IL 60625 and is currently estimated at $722,436, approximately $401 per square foot. 4529 N Drake Ave is a home located in Cook County with nearby schools including Haugan Elementary School, Roosevelt High School, and ASPIRA Haugan Middle School.
Ownership History
Date
Name
Owned For
Owner Type
Purchase Details
Closed on
Dec 30, 2010
Sold by
Fy Development Llc
Bought by
Mckinney Dana and Mckinney Anthony
Current Estimated Value
Purchase Details
Closed on
Apr 12, 2010
Sold by
5055 Montan Corp
Bought by
Fy Developments Llc Drake Series
Purchase Details
Closed on
Mar 11, 2010
Sold by
Deutsche Bank National Trust Company
Bought by
5055 Montan Corp
Purchase Details
Closed on
Jun 19, 2009
Sold by
Campos
Bought by
Deutsche Bank National Trust Company
Purchase Details
Closed on
Aug 23, 2006
Sold by
Campos Jose F and Campos Benigno
Bought by
Campos Jose F
Purchase Details
Closed on
Feb 11, 2005
Sold by
Paiz Miguel Enrique
Bought by
Campos Jose F and Campos Benigno
Purchase Details
Closed on
Sep 18, 2002
Sold by
Paiz Miguel Enrique and Paiz Irma C
Bought by
Paiz Miguel Enrique
Create a Home Valuation Report for This Property
The Home Valuation Report is an in-depth analysis detailing your home's value as well as a comparison with similar homes in the area
Home Values in the Area
Average Home Value in this Area
Purchase History
| Date | Buyer | Sale Price | Title Company |
|---|---|---|---|
| Mckinney Dana | $395,000 | First American Title Ins Co | |
| Fy Developments Llc Drake Series | -- | Premier Title | |
| 5055 Montan Corp | $141,000 | Premier Title | |
| Deutsche Bank National Trust Company | -- | None Available | |
| Campos Jose F | -- | None Available | |
| Campos Jose F | $408,000 | Chicago Title Insurance Comp | |
| Paiz Miguel Enrique | -- | Dukane Title Insurance Co |
Source: Public Records
Tax History Compared to Growth
Tax History
| Year | Tax Paid | Tax Assessment Tax Assessment Total Assessment is a certain percentage of the fair market value that is determined by local assessors to be the total taxable value of land and additions on the property. | Land | Improvement |
|---|---|---|---|---|
| 2024 | $7,556 | $51,000 | $11,025 | $39,975 |
| 2023 | $7,344 | $39,000 | $8,820 | $30,180 |
| 2022 | $7,344 | $39,000 | $8,820 | $30,180 |
| 2021 | $7,196 | $39,000 | $8,820 | $30,180 |
| 2020 | $7,221 | $35,406 | $4,567 | $30,839 |
| 2019 | $7,328 | $39,783 | $4,567 | $35,216 |
| 2018 | $7,203 | $39,783 | $4,567 | $35,216 |
| 2017 | $6,368 | $32,858 | $4,095 | $28,763 |
| 2016 | $6,101 | $32,858 | $4,095 | $28,763 |
| 2015 | $5,560 | $32,858 | $4,095 | $28,763 |
| 2014 | $5,186 | $30,417 | $3,780 | $26,637 |
| 2013 | $5,072 | $30,417 | $3,780 | $26,637 |
Source: Public Records
Map
Nearby Homes
- 4534 N Saint Louis Ave
- 4621 N Monticello Ave
- 4426 N Drake Ave
- 4619 N Lawndale Ave Unit 1
- 3550 W Montrose Ave Unit 107
- 4734 N Drake Ave
- 3733 W Sunnyside Ave
- 4515 N Hamlin Ave
- 3711 W Lawrence Ave
- 4438 N Spaulding Ave
- 4322 N Kimball Ave
- 4714 N Spaulding Ave
- 4249 N Central Park Ave
- 4304 N Lawndale Ave
- 3816 W Montrose Ave
- 3707 W Cullom Ave Unit 1
- 4246 N Kimball Ave
- 4906 N Drake Ave Unit 3
- 3618 W Ainslie St Unit 3W
- 4903 N Monticello Ave Unit 3
- 4525 N Drake Ave
- 4531 N Drake Ave
- 4523 N Drake Ave Unit 2
- 4533 N Drake Ave Unit 1
- 4521 N Drake Ave Unit 2
- 4521 N Drake Ave
- 4537 N Drake Ave
- 4517 N Drake Ave Unit 2
- 4517 N Drake Ave
- 4541 N Drake Ave
- 4543 N Drake Ave
- 4543 N Drake Ave Unit 2
- 4513 N Drake Ave
- 4522 N Saint Louis Ave
- 4526 N Saint Louis Ave Unit 2
- 4526 N Saint Louis Ave
- 4538 N Saint Louis Ave
- 4545 N Drake Ave
- 4518 N Saint Louis Ave
- 4534 N Drake Ave Unit 1