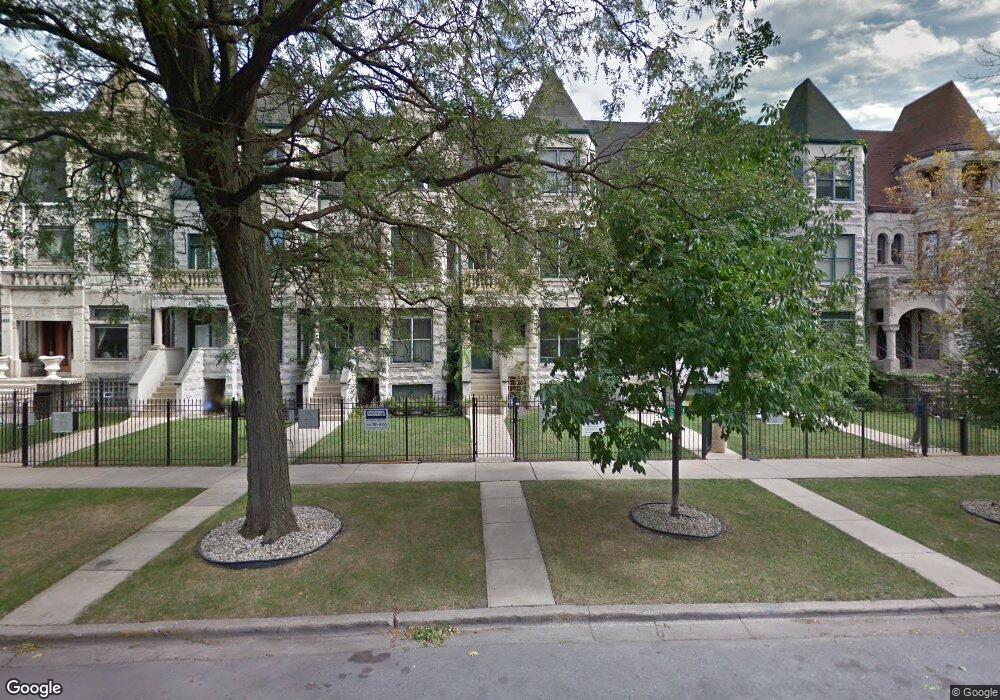
4529 S Ellis Ave Unit 45292 Chicago, IL 60653
Kenwood NeighborhoodEstimated Value: $377,000 - $550,000
4
Beds
2
Baths
2,800
Sq Ft
$163/Sq Ft
Est. Value
About This Home
This home is located at 4529 S Ellis Ave Unit 45292, Chicago, IL 60653 and is currently estimated at $456,014, approximately $162 per square foot. 4529 S Ellis Ave Unit 45292 is a home located in Cook County with nearby schools including Woodson South Elementary School, Robinson Elementary School, and The UChicago Charter School - North Kenwood/Oakland.
Ownership History
Date
Name
Owned For
Owner Type
Purchase Details
Closed on
Apr 21, 2018
Sold by
Gallentine Zachary and Kang Yoon Ji
Bought by
Gallentine Zachary and Kang Yoon Ji
Current Estimated Value
Purchase Details
Closed on
Mar 22, 2016
Sold by
Scott Steven M
Bought by
Gallentine Zachary
Home Financials for this Owner
Home Financials are based on the most recent Mortgage that was taken out on this home.
Original Mortgage
$253,728
Outstanding Balance
$202,281
Interest Rate
3.87%
Mortgage Type
New Conventional
Estimated Equity
$253,733
Purchase Details
Closed on
May 26, 2006
Sold by
Scott Steven M
Bought by
Scott Steven M and The Steven M Scott Living Trust
Purchase Details
Closed on
Nov 2, 2005
Sold by
45Th & Ellis Llc
Bought by
Scott Steven M
Home Financials for this Owner
Home Financials are based on the most recent Mortgage that was taken out on this home.
Original Mortgage
$332,300
Interest Rate
6.04%
Mortgage Type
Fannie Mae Freddie Mac
Create a Home Valuation Report for This Property
The Home Valuation Report is an in-depth analysis detailing your home's value as well as a comparison with similar homes in the area
Home Values in the Area
Average Home Value in this Area
Purchase History
| Date | Buyer | Sale Price | Title Company |
|---|---|---|---|
| Gallentine Zachary | -- | Attorney | |
| Gallentine Zachary | $317,500 | Attorneys Title Guaranty Fun | |
| Scott Steven M | -- | None Available | |
| Scott Steven M | $350,000 | Cti |
Source: Public Records
Mortgage History
| Date | Status | Borrower | Loan Amount |
|---|---|---|---|
| Open | Gallentine Zachary | $253,728 | |
| Previous Owner | Scott Steven M | $332,300 |
Source: Public Records
Tax History Compared to Growth
Tax History
| Year | Tax Paid | Tax Assessment Tax Assessment Total Assessment is a certain percentage of the fair market value that is determined by local assessors to be the total taxable value of land and additions on the property. | Land | Improvement |
|---|---|---|---|---|
| 2024 | $6,776 | $36,101 | $5,899 | $30,202 |
| 2023 | $6,582 | $32,000 | $5,899 | $26,101 |
| 2022 | $6,582 | $32,000 | $5,899 | $26,101 |
| 2021 | $6,435 | $31,999 | $5,898 | $26,101 |
| 2020 | $6,199 | $27,826 | $2,865 | $24,961 |
| 2019 | $6,176 | $30,742 | $2,865 | $27,877 |
| 2018 | $6,073 | $30,742 | $2,865 | $27,877 |
| 2017 | $6,840 | $31,773 | $2,359 | $29,414 |
| 2016 | $6,364 | $31,773 | $2,359 | $29,414 |
| 2015 | $5,822 | $31,773 | $2,359 | $29,414 |
| 2014 | $5,635 | $30,369 | $2,022 | $28,347 |
| 2013 | $5,523 | $30,369 | $2,022 | $28,347 |
Source: Public Records
Map
Nearby Homes
- 4553 S Ellis Ave
- 928 E 46th St
- 4635 S Greenwood Ave
- 4529 S Drexel Blvd Unit 452912
- 4527 S Drexel Blvd Unit 3S
- 4527 S Drexel Blvd Unit 1W
- 4530 S Woodlawn Ave Unit 101
- 4458 S Greenwood Ave Unit 1E
- 4456 S Berkeley Ave
- 4537 S Drexel Blvd Unit 706
- 4537 S Drexel Blvd Unit 504
- 4537 S Drexel Blvd Unit 303
- 4453 S Berkeley Ave Unit 1
- 4444 S Berkeley Ave
- 1150 E 46th St
- 4518 S Woodlawn Ave Unit 4518
- 4719 S Ingleside Ave
- 4717 S Ingleside Ave
- 4721 S Ingleside Ave
- 4730 S Greenwood Ave
- 4525 S Ellis Ave Unit 2
- 4525 S Ellis Ave
- 4525 S Ellis Ave Unit P2
- 4525 S Ellis Ave Unit P1
- 4525 S Ellis Ave Unit 45252
- 4525 S Ellis Ave Unit 45251
- 4525 S Ellis Ave Unit 1
- 4527 S Ellis Ave Unit P4
- 4527 S Ellis Ave Unit 1
- 4527 S Ellis Ave Unit P3
- 4527 S Ellis Ave Unit 45272
- 4527 S Ellis Ave Unit 2
- 4529 S Ellis Ave Unit P6
- 4529 S Ellis Ave Unit P5
- 4529 S Ellis Ave Unit 45291
- 4529 S Ellis Ave Unit 2
- 4523 S Ellis Ave
- 4531 S Ellis Ave Unit 45312
- 4531 S Ellis Ave Unit 45311
- 4531 S Ellis Ave Unit P9