Estimated Value: $290,789 - $313,000
3
Beds
2
Baths
2,006
Sq Ft
$153/Sq Ft
Est. Value
About This Home
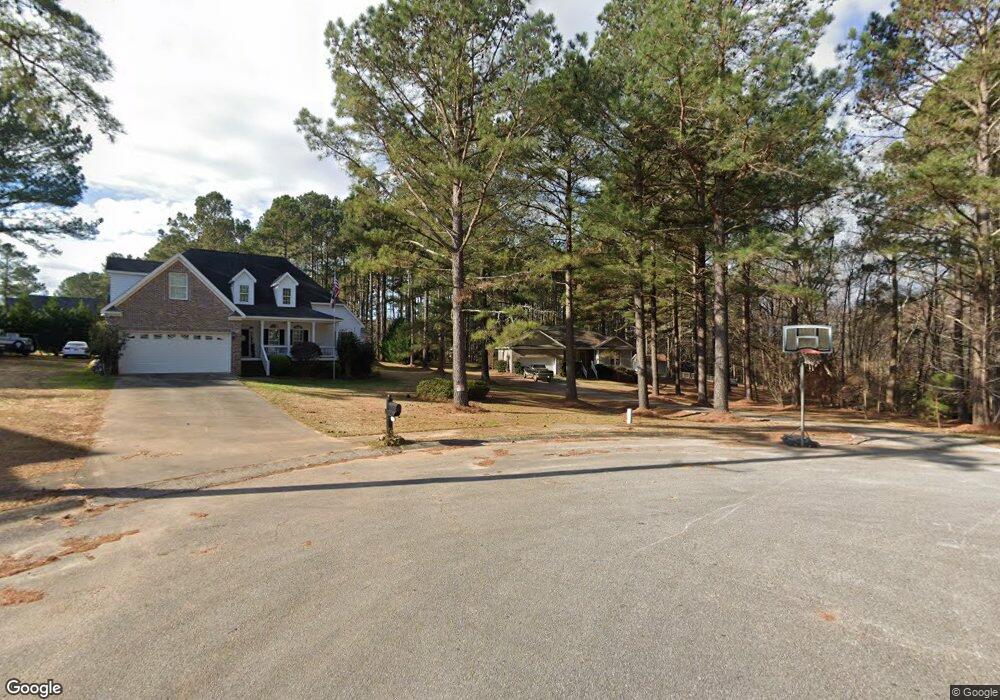
This home is located at 453 Annies Path, Gray, GA 31032 and is currently estimated at $305,947, approximately $152 per square foot. 453 Annies Path is a home located in Jones County with nearby schools including Gray Elementary School, Gray Station Middle School, and Jones County High School.
Ownership History
Date
Name
Owned For
Owner Type
Purchase Details
Closed on
May 13, 2019
Sold by
Brooks Freeman Charles
Bought by
Brooks Bonnie Toarmina
Current Estimated Value
Purchase Details
Closed on
Mar 26, 2010
Sold by
Federal National Mortgage Association
Bought by
Brooks F Charles
Home Financials for this Owner
Home Financials are based on the most recent Mortgage that was taken out on this home.
Original Mortgage
$158,163
Interest Rate
5.02%
Mortgage Type
New Conventional
Purchase Details
Closed on
Oct 21, 2005
Sold by
Prosperi Michael
Bought by
Garcia Rolando
Purchase Details
Closed on
Apr 8, 2005
Sold by
Milholen Properties Inc
Bought by
Garcia Rolando and Prosperi Michael
Home Financials for this Owner
Home Financials are based on the most recent Mortgage that was taken out on this home.
Original Mortgage
$160,075
Interest Rate
5.79%
Mortgage Type
New Conventional
Create a Home Valuation Report for This Property
The Home Valuation Report is an in-depth analysis detailing your home's value as well as a comparison with similar homes in the area
Home Values in the Area
Average Home Value in this Area
Purchase History
| Date | Buyer | Sale Price | Title Company |
|---|---|---|---|
| Brooks Bonnie Toarmina | -- | -- | |
| Brooks F Charles | $155,000 | -- | |
| Brooks F Charles | $155,000 | -- | |
| Garcia Rolando | $179,100 | -- | |
| Garcia Rolando | $27,900 | -- |
Source: Public Records
Mortgage History
| Date | Status | Borrower | Loan Amount |
|---|---|---|---|
| Previous Owner | Brooks F Charles | $158,163 | |
| Previous Owner | Garcia Rolando | $160,075 |
Source: Public Records
Tax History
| Year | Tax Paid | Tax Assessment Tax Assessment Total Assessment is a certain percentage of the fair market value that is determined by local assessors to be the total taxable value of land and additions on the property. | Land | Improvement |
|---|---|---|---|---|
| 2025 | $3,270 | $103,382 | $14,040 | $89,342 |
| 2023 | $1,674 | $67,934 | $10,800 | $57,134 |
| 2022 | $2,300 | $67,718 | $10,584 | $57,134 |
| 2021 | $2,435 | $67,718 | $10,584 | $57,134 |
| 2020 | $2,437 | $67,718 | $10,584 | $57,134 |
| 2019 | $2,304 | $67,718 | $10,584 | $57,134 |
| 2018 | $2,304 | $67,718 | $10,584 | $57,134 |
| 2017 | $2,304 | $67,718 | $10,584 | $57,134 |
| 2016 | $2,304 | $67,718 | $10,584 | $57,134 |
| 2015 | $2,176 | $67,718 | $10,584 | $57,134 |
| 2014 | $2,009 | $67,718 | $10,584 | $57,134 |
Source: Public Records
Map
Nearby Homes
- 141 Hidden Lakes Dr
- 203 Hidden Lakes Dr
- 0 Bill Conn Pkwy
- 00 Hidden Hills Ct
- 146 Overland Way
- 144 Overland Way
- 184 Stone Brooke Dr
- 766 Natures Walk
- 122 Oak Dr
- 115 Oak Dr
- 132 Oak Dr
- 1104 Boulder Dr
- 1023 Boulder Lot 65 Dr
- 1023 Boulder Dr Unit LOT 65
- 250 Stone Brooke Lot 133 Dr
- 250 Stone Brooke Dr Unit LOT 133
- 250 Stone Brooke Dr
- 229 Lite N Tie Rd
- 854 Natures Walk
- 000 Walnut Grove Rd
- 451 Annies Path
- 164 Hidden Lakes Dr
- 170 Hidden Lakes Dr
- 449 Annies Path
- 448 Annies Path
- 160 Hidden Lakes Dr Unit 15
- 445 Annies Path
- 507 Poplar Ct
- 443 Annies Path
- 148 Hidden Lakes Dr
- 172 Hidden Lakes Dr
- 513 Poplar Ct
- Lot 28 Poplar Ct
- Lot 29 Poplar Ct
- 169 Hidden Lakes Dr
- 502 Poplar Ct
- 165 Hidden Lakes Dr
- 439 Annies Path
- 161 Hidden Lakes Dr
- 510 Poplar Ct
Your Personal Tour Guide
Ask me questions while you tour the home.