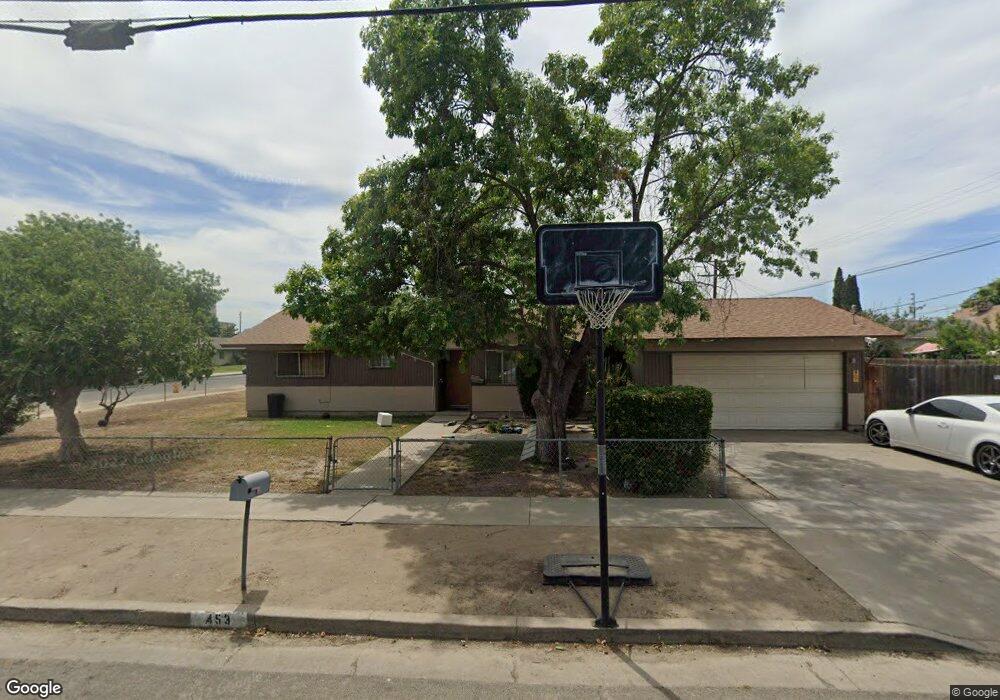
453 Center St Tulare, CA 93274
Tulare Southeast NeighborhoodEstimated Value: $238,114 - $289,000
--
Bed
1
Bath
1,320
Sq Ft
$203/Sq Ft
Est. Value
About This Home
This home is located at 453 Center St, Tulare, CA 93274 and is currently estimated at $268,529, approximately $203 per square foot. 453 Center St is a home located in Tulare County with nearby schools including Wilson Elementary School, Cherry Avenue Middle School, and Tulare Union High School.
Ownership History
Date
Name
Owned For
Owner Type
Purchase Details
Closed on
May 22, 2020
Sold by
Hudson Albert C
Bought by
Green Martha Ann
Current Estimated Value
Home Financials for this Owner
Home Financials are based on the most recent Mortgage that was taken out on this home.
Original Mortgage
$120,750
Outstanding Balance
$107,001
Interest Rate
3.3%
Mortgage Type
New Conventional
Estimated Equity
$161,528
Purchase Details
Closed on
May 19, 2020
Sold by
Hudson Martha Ann and Wilson Ruth Pearl
Bought by
Hudson Martha Ann
Home Financials for this Owner
Home Financials are based on the most recent Mortgage that was taken out on this home.
Original Mortgage
$120,750
Outstanding Balance
$107,001
Interest Rate
3.3%
Mortgage Type
New Conventional
Estimated Equity
$161,528
Purchase Details
Closed on
Jun 30, 2005
Sold by
Wilson Ray Lee
Bought by
Green Martha Ann and Wilson Ruth Pearl
Create a Home Valuation Report for This Property
The Home Valuation Report is an in-depth analysis detailing your home's value as well as a comparison with similar homes in the area
Home Values in the Area
Average Home Value in this Area
Purchase History
| Date | Buyer | Sale Price | Title Company |
|---|---|---|---|
| Green Martha Ann | -- | First American Title Company | |
| Hudson Martha Ann | -- | First American Title Company | |
| Green Martha Ann | -- | -- |
Source: Public Records
Mortgage History
| Date | Status | Borrower | Loan Amount |
|---|---|---|---|
| Open | Green Martha Ann | $120,750 |
Source: Public Records
Tax History Compared to Growth
Tax History
| Year | Tax Paid | Tax Assessment Tax Assessment Total Assessment is a certain percentage of the fair market value that is determined by local assessors to be the total taxable value of land and additions on the property. | Land | Improvement |
|---|---|---|---|---|
| 2025 | $1,229 | $112,951 | $22,080 | $90,871 |
| 2024 | $1,229 | $110,738 | $21,648 | $89,090 |
| 2023 | $1,198 | $108,568 | $21,224 | $87,344 |
| 2022 | $1,163 | $106,440 | $20,808 | $85,632 |
| 2021 | $1,148 | $104,353 | $20,400 | $83,953 |
| 2020 | $583 | $51,547 | $5,372 | $46,175 |
| 2019 | $597 | $50,537 | $5,267 | $45,270 |
| 2018 | $588 | $49,546 | $5,164 | $44,382 |
| 2017 | $582 | $48,575 | $5,063 | $43,512 |
| 2016 | $557 | $47,623 | $4,964 | $42,659 |
| 2015 | $538 | $46,907 | $4,889 | $42,018 |
| 2014 | $538 | $45,988 | $4,793 | $41,195 |
Source: Public Records
Map
Nearby Homes
- 620 Mariposa Ave
- 813 E Inyo Ave
- 629 S R St
- 708 E Tulare Ave
- 815 E Sycamore Ave
- 752 S T St
- 861 E Sycamore Ave
- 149 S Salida Place
- 1065 E Cedar Ave
- 741 E San Joaquin Ave
- 202 N L St
- 538 S H St
- 544 S G St
- 225 N I St
- 237 W Tulare Ave
- 120 S G St
- 900 S Ann St
- 980 S Spruce St
- 3044 Isleworth Ave Unit 538 Sft
- 501 S Magnolia St
- 656 E Sonora Ave
- 652 E Sonora Ave
- 661 E Ventura Ave
- 644 E Sonora Ave
- 657 E Ventura Ave
- 541 Center St
- 649 E Ventura Ave
- 437 Center St
- 636 E Sonora Ave
- 701 E Sonora Ave
- 657 E Sonora Ave
- 639 E Ventura Ave
- 703 E Ventura Ave
- 626 E Sonora Ave
- 717 E Sonora Ave
- 631 E Ventura Ave
- 707 E Ventura Ave
- 623 E Ventura Ave
- 727 E Sonora Ave
- 719 E Ventura Ave Unit 1