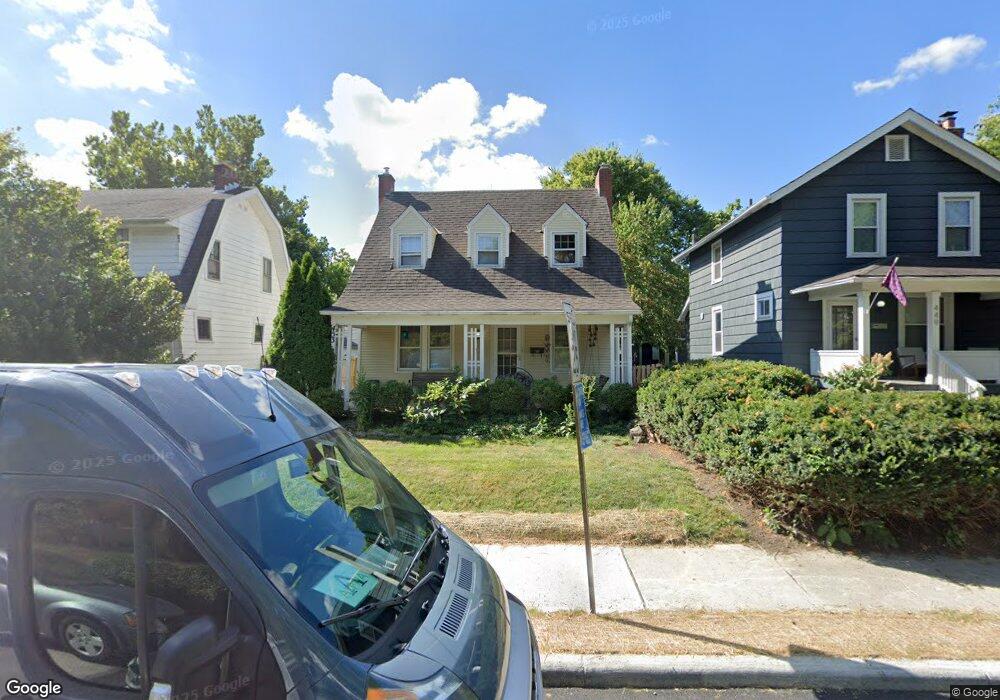
453 E Tulane Rd Columbus, OH 43202
Clintonville NeighborhoodEstimated Value: $374,727 - $411,000
3
Beds
1
Bath
1,224
Sq Ft
$318/Sq Ft
Est. Value
About This Home
This home is located at 453 E Tulane Rd, Columbus, OH 43202 and is currently estimated at $389,432, approximately $318 per square foot. 453 E Tulane Rd is a home located in Franklin County with nearby schools including Clinton Elementary School, Dominion Middle School, and Whetstone High School.
Ownership History
Date
Name
Owned For
Owner Type
Purchase Details
Closed on
Oct 29, 2007
Sold by
Beetar John T
Bought by
May John R
Current Estimated Value
Home Financials for this Owner
Home Financials are based on the most recent Mortgage that was taken out on this home.
Original Mortgage
$140,000
Outstanding Balance
$87,276
Interest Rate
6.45%
Mortgage Type
Purchase Money Mortgage
Estimated Equity
$302,156
Purchase Details
Closed on
Jun 15, 2004
Sold by
Coleman Charles Edward and Coleman Karen Lynn
Bought by
Beetar John T
Home Financials for this Owner
Home Financials are based on the most recent Mortgage that was taken out on this home.
Original Mortgage
$133,600
Interest Rate
4.87%
Mortgage Type
Purchase Money Mortgage
Purchase Details
Closed on
Sep 19, 1997
Sold by
Coleman Charles E and Coleman Karen L
Bought by
Coleman Charles Edward and Coleman Karen Lynn
Purchase Details
Closed on
Jun 4, 1986
Bought by
Coleman Charles E
Create a Home Valuation Report for This Property
The Home Valuation Report is an in-depth analysis detailing your home's value as well as a comparison with similar homes in the area
Home Values in the Area
Average Home Value in this Area
Purchase History
| Date | Buyer | Sale Price | Title Company |
|---|---|---|---|
| May John R | $175,000 | Peak Title | |
| Beetar John T | $167,000 | Chicago Tit | |
| Coleman Charles Edward | -- | -- | |
| Coleman Charles E | $66,900 | -- |
Source: Public Records
Mortgage History
| Date | Status | Borrower | Loan Amount |
|---|---|---|---|
| Open | May John R | $140,000 | |
| Previous Owner | Beetar John T | $133,600 |
Source: Public Records
Tax History
| Year | Tax Paid | Tax Assessment Tax Assessment Total Assessment is a certain percentage of the fair market value that is determined by local assessors to be the total taxable value of land and additions on the property. | Land | Improvement |
|---|---|---|---|---|
| 2025 | $4,419 | $108,260 | $35,840 | $72,420 |
| 2024 | $4,419 | $108,260 | $35,840 | $72,420 |
| 2023 | $4,390 | $108,255 | $35,840 | $72,415 |
| 2022 | $3,900 | $83,940 | $26,500 | $57,440 |
| 2021 | $3,907 | $83,940 | $26,500 | $57,440 |
| 2020 | $3,912 | $83,940 | $26,500 | $57,440 |
| 2019 | $3,261 | $62,510 | $20,370 | $42,140 |
| 2018 | $2,939 | $62,510 | $20,370 | $42,140 |
| 2017 | $3,259 | $62,510 | $20,370 | $42,140 |
| 2016 | $3,469 | $61,120 | $16,980 | $44,140 |
| 2015 | $3,149 | $61,120 | $16,980 | $44,140 |
| 2014 | $3,684 | $61,120 | $16,980 | $44,140 |
| 2013 | $1,793 | $60,305 | $16,170 | $44,135 |
Source: Public Records
Map
Nearby Homes
- 2836-2838 Indianola Ave Unit 2836
- 555 E Weber Rd
- 580 Crestview Rd
- 415 Glen Echo Cir
- 2680 Deming Ave
- 2733 Beulah Rd
- 296 Walhalla Rd
- 534 Walhalla Rd
- 589 Clinton Heights Ave
- 363 E Hudson St Unit 365
- 759 E Longview Ave
- 109 E Arcadia Ave
- 53 Olentangy St
- 61 Tibet Rd
- 2569 Audubon Rd
- 2458- 2458 1 2 Deming Ave
- 45 E California Ave
- 2593 Osceola Ave
- 3035 Audubon Rd
- 76 E Lakeview Ave
- 459 E Tulane Rd
- 449 E Tulane Rd
- 469 E Tulane Rd
- 448 Crestview Rd
- 442 Crestview Rd
- 454 Crestview Rd
- 2890 Indianola Ave Unit 892
- 2894 Indianola Ave Unit 896
- 2884 Indianola Ave Unit 886
- 2884 Indianola Ave Unit 2
- 458 Crestview Rd
- 475 E Tulane Rd
- 456 E Tulane Rd
- 2880 Indianola Ave
- 462 E Tulane Rd
- 450 E Tulane Rd
- 466 E Tulane Rd
- 2876 Indianola Ave
- 2908 Indianola Ave
- 2878 Indianola Ave
Your Personal Tour Guide
Ask me questions while you tour the home.