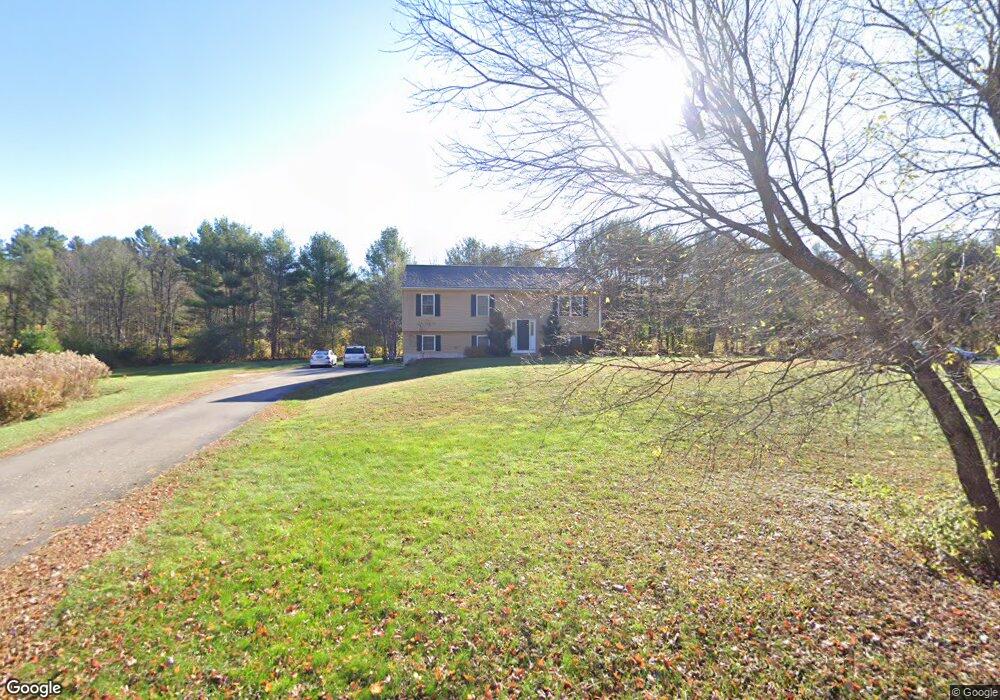
453 Howe St East Brookfield, MA 01515
Estimated Value: $376,000 - $504,000
3
Beds
1
Bath
1,144
Sq Ft
$371/Sq Ft
Est. Value
About This Home
This home is located at 453 Howe St, East Brookfield, MA 01515 and is currently estimated at $424,221, approximately $370 per square foot. 453 Howe St is a home located in Worcester County with nearby schools including David Prouty High School.
Ownership History
Date
Name
Owned For
Owner Type
Purchase Details
Closed on
Aug 5, 2022
Sold by
Curtis Jean M
Bought by
Curtis Brian H and Curtis Jean M
Current Estimated Value
Purchase Details
Closed on
Sep 24, 2010
Sold by
Toomey Lovett Inc
Bought by
Curtis Jean M
Home Financials for this Owner
Home Financials are based on the most recent Mortgage that was taken out on this home.
Original Mortgage
$48,000
Interest Rate
4.48%
Mortgage Type
Purchase Money Mortgage
Create a Home Valuation Report for This Property
The Home Valuation Report is an in-depth analysis detailing your home's value as well as a comparison with similar homes in the area
Home Values in the Area
Average Home Value in this Area
Purchase History
| Date | Buyer | Sale Price | Title Company |
|---|---|---|---|
| Curtis Brian H | -- | None Available | |
| Curtis Jean M | $200,000 | -- | |
| Curtis Jean M | $200,000 | -- |
Source: Public Records
Mortgage History
| Date | Status | Borrower | Loan Amount |
|---|---|---|---|
| Previous Owner | Curtis Jean M | $48,000 |
Source: Public Records
Tax History Compared to Growth
Tax History
| Year | Tax Paid | Tax Assessment Tax Assessment Total Assessment is a certain percentage of the fair market value that is determined by local assessors to be the total taxable value of land and additions on the property. | Land | Improvement |
|---|---|---|---|---|
| 2025 | $4,244 | $330,500 | $70,600 | $259,900 |
| 2024 | $4,092 | $320,400 | $64,000 | $256,400 |
| 2023 | $3,616 | $275,800 | $58,300 | $217,500 |
| 2022 | $3,692 | $272,900 | $50,500 | $222,400 |
| 2021 | $3,525 | $237,700 | $50,500 | $187,200 |
| 2020 | $3,323 | $224,200 | $50,500 | $173,700 |
| 2019 | $3,390 | $205,800 | $50,500 | $155,300 |
| 2018 | $3,126 | $202,200 | $50,600 | $151,600 |
| 2017 | $3,048 | $187,200 | $46,800 | $140,400 |
| 2016 | $3,094 | $177,200 | $46,800 | $130,400 |
| 2015 | $3,076 | $177,200 | $46,800 | $130,400 |
| 2014 | $3,087 | $177,200 | $46,800 | $130,400 |
Source: Public Records
Map
Nearby Homes
- 145 Draper Rd
- 9 Hebert Rd
- 31 Lyford Rd
- 38 S Spencer Rd
- 294 E Main St
- 112 Gleason Ave
- 111 Drake Ln
- 210 E Main St
- 0 North St
- 172 Stone Rd
- 86 Jolicoeur Ave
- 70 Quaboag St
- 0 Oakland Dr
- 3 Cranberry Meadow Shore Rd
- 23 Shore Rd
- 2 Crestview Dr Unit 52
- 79-83.5 Maple St
- 149 Dunnbrook Rd
- 4 Crestview Dr Unit 55
- 0 I Capen Rd