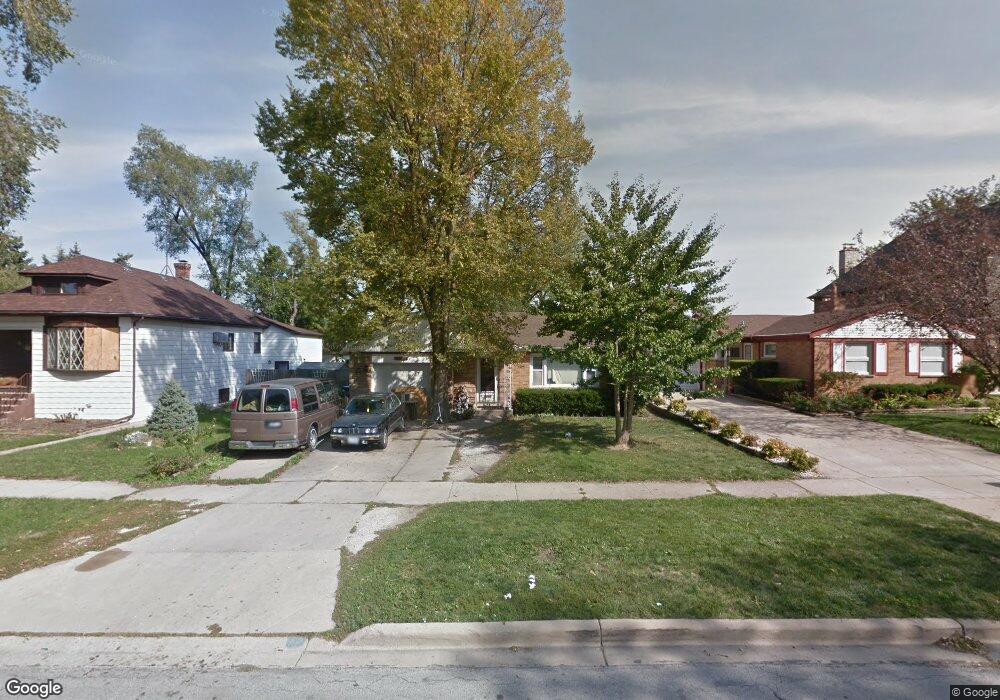
453 N Addison Ave Elmhurst, IL 60126
Estimated Value: $528,581 - $665,000
4
Beds
4
Baths
3,350
Sq Ft
$173/Sq Ft
Est. Value
About This Home
This home is located at 453 N Addison Ave, Elmhurst, IL 60126 and is currently estimated at $578,645, approximately $172 per square foot. 453 N Addison Ave is a home located in DuPage County with nearby schools including Emerson Elementary School, Churchville Middle School, and York Community High School.
Ownership History
Date
Name
Owned For
Owner Type
Purchase Details
Closed on
Sep 6, 2005
Sold by
Pedote Dennis P and Pedote Mary Therese
Bought by
Henriksen Steven
Current Estimated Value
Home Financials for this Owner
Home Financials are based on the most recent Mortgage that was taken out on this home.
Original Mortgage
$200,000
Outstanding Balance
$107,135
Interest Rate
5.87%
Mortgage Type
Fannie Mae Freddie Mac
Estimated Equity
$471,510
Purchase Details
Closed on
May 17, 2002
Sold by
Prodoehl Howard and The Prodoehl Family Trust
Bought by
Pedote Dennis P and Pedote Mary Therese
Home Financials for this Owner
Home Financials are based on the most recent Mortgage that was taken out on this home.
Original Mortgage
$202,500
Interest Rate
6.5%
Purchase Details
Closed on
Nov 19, 1997
Sold by
Firstar Bank Illinois
Bought by
Prodoehl Howard G and The Prodoehl Family Trust
Create a Home Valuation Report for This Property
The Home Valuation Report is an in-depth analysis detailing your home's value as well as a comparison with similar homes in the area
Home Values in the Area
Average Home Value in this Area
Purchase History
| Date | Buyer | Sale Price | Title Company |
|---|---|---|---|
| Henriksen Steven | -- | Ticor | |
| Pedote Dennis P | $225,000 | -- | |
| Prodoehl Howard G | -- | -- |
Source: Public Records
Mortgage History
| Date | Status | Borrower | Loan Amount |
|---|---|---|---|
| Open | Henriksen Steven | $200,000 | |
| Previous Owner | Pedote Dennis P | $202,500 |
Source: Public Records
Tax History
| Year | Tax Paid | Tax Assessment Tax Assessment Total Assessment is a certain percentage of the fair market value that is determined by local assessors to be the total taxable value of land and additions on the property. | Land | Improvement |
|---|---|---|---|---|
| 2024 | $8,375 | $144,754 | $70,816 | $73,938 |
| 2023 | $7,719 | $133,070 | $65,100 | $67,970 |
| 2022 | $7,430 | $127,300 | $62,300 | $65,000 |
| 2021 | $7,111 | $121,930 | $59,670 | $62,260 |
| 2020 | $6,688 | $116,790 | $57,150 | $59,640 |
| 2019 | $6,618 | $112,300 | $54,950 | $57,350 |
| 2018 | $6,181 | $104,690 | $52,340 | $52,350 |
| 2017 | $6,057 | $100,050 | $50,020 | $50,030 |
| 2016 | $5,797 | $92,370 | $46,180 | $46,190 |
| 2015 | $5,677 | $85,330 | $42,660 | $42,670 |
| 2014 | $5,014 | $70,400 | $35,200 | $35,200 |
| 2013 | $4,996 | $71,840 | $35,920 | $35,920 |
Source: Public Records
Map
Nearby Homes
- 132 E Gladys Ave
- 456 N Elm Ave
- 305 N Addison Ave
- 183 E Grantley Ave
- 266 W Fremont Ave
- 260 N Addison Ave
- 258 N Addison Ave
- 256 N Addison Ave
- 254 N Addison Ave
- 234 E Grantley Ave
- 365 N Walnut St
- 516 N Emroy Ave
- 260 E Grantley Ave
- 564 N Adele St
- 367 N Oak St
- 272 N Willow Rd
- 195 N Addison Ave Unit PH03
- 240 N Willow Rd
- 322 N Highland Ave
- 468 N Highland Ave
- 451 N Addison Ave
- 455 N Addison Ave
- 447 N Addison Ave
- 459 N Addison Ave
- 465 N Addison Ave
- 450 N Addison Ave
- 441 N Addison Ave
- 444 N Addison Ave
- 456 N Addison Ave
- 435 N Addison Ave
- 471 N Addison Ave
- 450 N York St
- 448 N York St
- 458 N Addison Ave
- 440 N Addison Ave
- 462 N Addison Ave
- 468 N Addison Ave
- 475 N Addison Ave
- 431 N Addison Ave
- 434 N Addison Ave