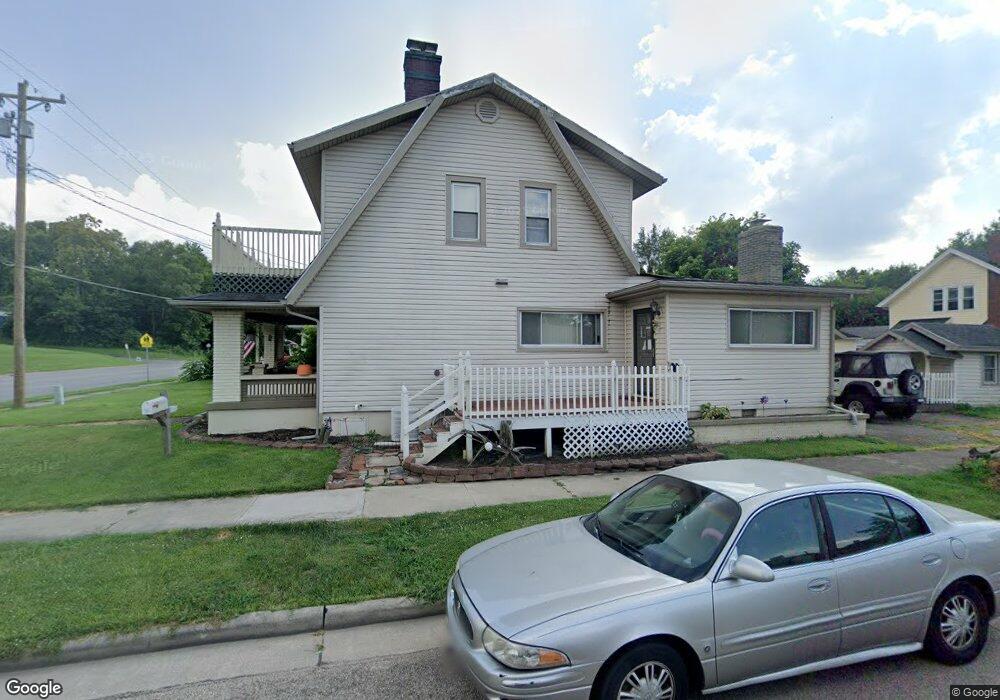
453 N Main St Franklin, OH 45005
Estimated Value: $170,000 - $186,919
2
Beds
2
Baths
1,696
Sq Ft
$105/Sq Ft
Est. Value
About This Home
This home is located at 453 N Main St, Franklin, OH 45005 and is currently estimated at $178,730, approximately $105 per square foot. 453 N Main St is a home located in Warren County with nearby schools including Franklin High School.
Ownership History
Date
Name
Owned For
Owner Type
Purchase Details
Closed on
Oct 8, 2003
Sold by
Hitte Morris Pamela Hope and Morris Charles S
Bought by
Hitte Morris Charles S and Hitte Morris Pamela Hope
Current Estimated Value
Purchase Details
Closed on
Sep 17, 2003
Sold by
Hitte Floyd R and Hitte Debra L
Bought by
Hitte Morris Pamela Hope
Purchase Details
Closed on
Dec 2, 1998
Sold by
Hitte Polly
Bought by
Hitte Floyd R
Purchase Details
Closed on
Nov 7, 1989
Sold by
Morris Charles S and Morris Pame
Bought by
Hitte and Hitte Polly
Purchase Details
Closed on
Sep 14, 1983
Sold by
Morris Emory and Morris Emory
Bought by
Morris and Morris Mildred
Create a Home Valuation Report for This Property
The Home Valuation Report is an in-depth analysis detailing your home's value as well as a comparison with similar homes in the area
Home Values in the Area
Average Home Value in this Area
Purchase History
| Date | Buyer | Sale Price | Title Company |
|---|---|---|---|
| Hitte Morris Charles S | -- | -- | |
| Hitte Morris Pamela Hope | $60,000 | -- | |
| Hitte Morris Pamela Hope | $60,000 | -- | |
| Hitte Floyd R | $235,000 | -- | |
| Hitte | -- | -- | |
| Morris | -- | -- |
Source: Public Records
Tax History
| Year | Tax Paid | Tax Assessment Tax Assessment Total Assessment is a certain percentage of the fair market value that is determined by local assessors to be the total taxable value of land and additions on the property. | Land | Improvement |
|---|---|---|---|---|
| 2025 | $2,508 | $45,740 | $11,360 | $34,380 |
| 2024 | $2,508 | $45,740 | $11,360 | $34,380 |
| 2023 | $1,989 | $34,489 | $6,440 | $28,049 |
| 2022 | $1,954 | $34,489 | $6,440 | $28,049 |
| 2021 | $1,862 | $34,489 | $6,440 | $28,049 |
| 2020 | $1,693 | $27,374 | $5,114 | $22,260 |
| 2019 | $1,556 | $27,374 | $5,114 | $22,260 |
| 2018 | $1,358 | $27,374 | $5,114 | $22,260 |
| 2017 | $1,606 | $25,897 | $4,911 | $20,986 |
| 2016 | $1,633 | $25,897 | $4,911 | $20,986 |
| 2015 | $1,634 | $25,897 | $4,911 | $20,986 |
| 2014 | $1,473 | $25,900 | $4,910 | $20,990 |
| 2013 | $1,265 | $29,960 | $5,680 | $24,280 |
Source: Public Records
Map
Nearby Homes
- 228 Bridge St
- 0 Victoria Dr Unit 942075
- 0 Victoria Dr Unit 1852824
- 5 S River St
- 210 N Riley Blvd
- 413 Spring Ave
- 33 Stadia Dr
- 551 E 2nd St
- 657 E 2nd St
- 205 Oxford Rd
- 651 E 2nd St
- 202 E 2nd St
- 605 Spring Ave
- 410 Park Ave
- 520 Arlington Ave
- 616 Lake Ave
- 309 Oxford Rd
- 509 Forest Ave
- 511 Forest Ave
- 0 E 4th St
Your Personal Tour Guide
Ask me questions while you tour the home.