453 N West St Tipton, IN 46072
Estimated Value: $182,000 - $216,241
4
Beds
2
Baths
2,237
Sq Ft
$88/Sq Ft
Est. Value
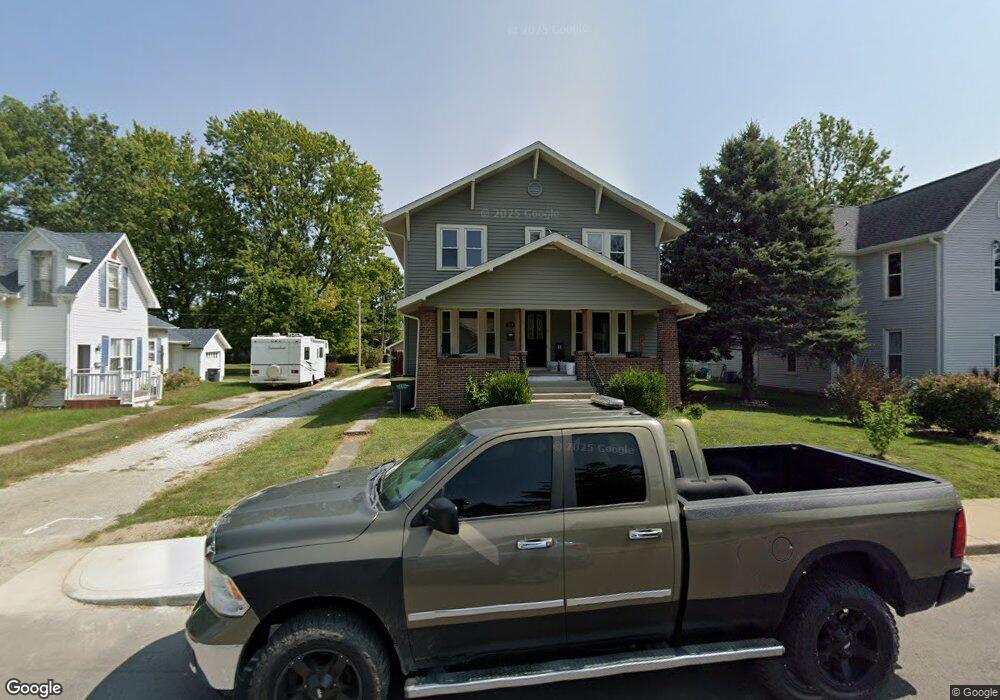
About This Home
This home is located at 453 N West St, Tipton, IN 46072 and is currently estimated at $197,560, approximately $88 per square foot. 453 N West St is a home located in Tipton County with nearby schools including Tipton Elementary School, Tipton Middle School, and Tipton High School.
Ownership History
Date
Name
Owned For
Owner Type
Purchase Details
Closed on
Sep 7, 2023
Sold by
Secretary Of Housing And Urban Developme
Bought by
Speer Ryan D
Current Estimated Value
Purchase Details
Closed on
Jun 6, 2023
Sold by
Lakeview Loan Serving Llc
Bought by
Secretary Of Housing And Urban Developme
Purchase Details
Closed on
Jan 5, 2023
Sold by
Matthew D Tebbe Tipton County Sherriff
Bought by
Lakeview Loan Servicing Llc
Purchase Details
Closed on
May 8, 2015
Sold by
Russell W Kirchner
Bought by
Redmon Charles D
Create a Home Valuation Report for This Property
The Home Valuation Report is an in-depth analysis detailing your home's value as well as a comparison with similar homes in the area
Home Values in the Area
Average Home Value in this Area
Purchase History
| Date | Buyer | Sale Price | Title Company |
|---|---|---|---|
| Speer Ryan D | $152,000 | Metropilitan Title Of Indiana, | |
| Secretary Of Housing And Urban Developme | $10 | Reisenfeld And Associates Llc | |
| Lakeview Loan Servicing Llc | $166,296 | -- | |
| Redmon Charles D | $124,900 | Moore Title & Escrow, Inc |
Source: Public Records
Tax History Compared to Growth
Tax History
| Year | Tax Paid | Tax Assessment Tax Assessment Total Assessment is a certain percentage of the fair market value that is determined by local assessors to be the total taxable value of land and additions on the property. | Land | Improvement |
|---|---|---|---|---|
| 2024 | $1,907 | $183,900 | $16,300 | $167,600 |
| 2023 | $1,838 | $177,000 | $16,300 | $160,700 |
| 2022 | $3,268 | $160,900 | $16,300 | $144,600 |
| 2021 | $2,975 | $146,600 | $14,200 | $132,400 |
| 2020 | $3,005 | $145,000 | $14,200 | $130,800 |
| 2019 | $2,782 | $133,800 | $14,200 | $119,600 |
| 2018 | $2,704 | $129,900 | $14,200 | $115,700 |
| 2017 | $2,692 | $129,200 | $15,200 | $114,000 |
| 2016 | $2,604 | $124,800 | $15,200 | $109,600 |
| 2014 | $696 | $113,300 | $12,100 | $101,200 |
| 2013 | $696 | $114,500 | $12,100 | $102,400 |
Source: Public Records
Map
Nearby Homes
- 465 N Main St
- 312 N West St
- 329 Columbia Ave
- 543 N East St
- 401 Sweetland Ave
- 315 W Washington St
- 337 Sweetland Ave
- 307 Douglas St
- 0000 State Road 28
- 803 N East St
- 304 Oak St
- 454 Maple St
- 920 N Main St
- 814 Mill St
- 128 1st St
- 932 N Main St
- 218 Maple St
- 316 W Adams St
- 1130 E Jefferson St
- 307 W Adams St