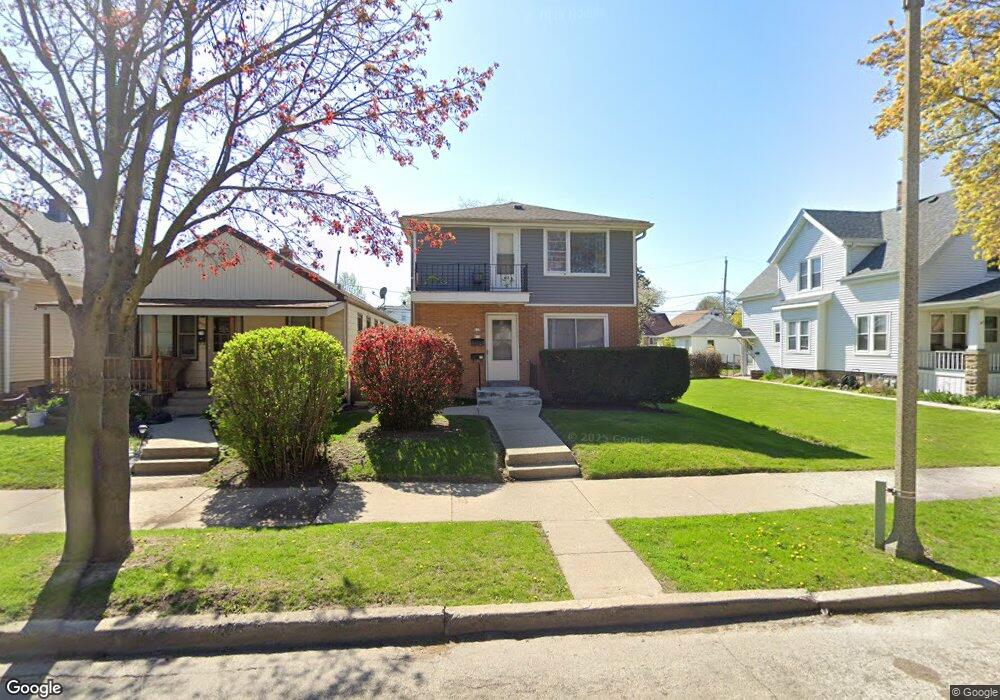
453 S 72nd St Unit 455 Milwaukee, WI 53214
Fair Park NeighborhoodEstimated Value: $263,998 - $297,000
6
Beds
2
Baths
1,824
Sq Ft
$155/Sq Ft
Est. Value
About This Home
This home is located at 453 S 72nd St Unit 455, Milwaukee, WI 53214 and is currently estimated at $283,250, approximately $155 per square foot. 453 S 72nd St Unit 455 is a home located in Milwaukee County with nearby schools including Burbank School, Milwaukee Spanish Immersion School - Upper Campus, and Milwaukee German Immersion School.
Ownership History
Date
Name
Owned For
Owner Type
Purchase Details
Closed on
Jan 27, 2016
Sold by
J & O Advantage Llc
Bought by
Mll Holding Llc
Current Estimated Value
Purchase Details
Closed on
Sep 20, 2012
Sold by
Equity Trust Company
Bought by
J & O Advantage Llc
Purchase Details
Closed on
Jul 1, 2011
Sold by
Parsley Stephanie
Bought by
Equity Trust Company and 103953 Roth Ira
Purchase Details
Closed on
Aug 30, 2004
Sold by
Jorgensen John T and Jorgensen Leslie A
Bought by
Parsley Stephanie E
Home Financials for this Owner
Home Financials are based on the most recent Mortgage that was taken out on this home.
Original Mortgage
$126,800
Interest Rate
5.95%
Mortgage Type
Purchase Money Mortgage
Create a Home Valuation Report for This Property
The Home Valuation Report is an in-depth analysis detailing your home's value as well as a comparison with similar homes in the area
Home Values in the Area
Average Home Value in this Area
Purchase History
| Date | Buyer | Sale Price | Title Company |
|---|---|---|---|
| Mll Holding Llc | -- | Attorney | |
| J & O Advantage Llc | $59,600 | None Available | |
| Equity Trust Company | $35,100 | None Available | |
| Parsley Stephanie E | $158,500 | -- |
Source: Public Records
Mortgage History
| Date | Status | Borrower | Loan Amount |
|---|---|---|---|
| Previous Owner | Parsley Stephanie E | $126,800 | |
| Closed | Parsley Stephanie E | $15,850 |
Source: Public Records
Tax History Compared to Growth
Tax History
| Year | Tax Paid | Tax Assessment Tax Assessment Total Assessment is a certain percentage of the fair market value that is determined by local assessors to be the total taxable value of land and additions on the property. | Land | Improvement |
|---|---|---|---|---|
| 2024 | $4,866 | $213,500 | $18,100 | $195,400 |
| 2023 | $4,201 | $177,800 | $18,100 | $159,700 |
| 2022 | $4,224 | $177,800 | $18,100 | $159,700 |
| 2021 | $3,326 | $126,700 | $19,300 | $107,400 |
| 2020 | $3,309 | $126,700 | $19,300 | $107,400 |
| 2019 | $3,373 | $119,300 | $12,500 | $106,800 |
| 2018 | $3,083 | $119,300 | $12,500 | $106,800 |
| 2017 | $3,109 | $116,600 | $7,800 | $108,800 |
| 2016 | $2,967 | $106,000 | $7,800 | $98,200 |
| 2015 | -- | $106,000 | $7,800 | $98,200 |
| 2014 | -- | $106,000 | $7,800 | $98,200 |
| 2013 | -- | $99,800 | $7,800 | $92,000 |
Source: Public Records
Map
Nearby Homes
- 453 S 72nd St Unit 453
- 453 S 72nd St
- 453 S 72nd St Unit upper
- 457 S 72nd St
- 501 S 72nd St
- 443 S 72nd St
- 505 S 72nd St
- 439 S 72nd St
- 452 S 73rd St Unit 454
- 458 S 73rd St
- 511 S 72nd St
- 448 S 73rd St
- 433 S 72nd St
- 500 S 73rd St
- 442 S 73rd St
- 504 S 73rd St
- 517 S 72nd St
- 429 S 72nd St
- 452 S 72nd St
- 446 S 72nd St