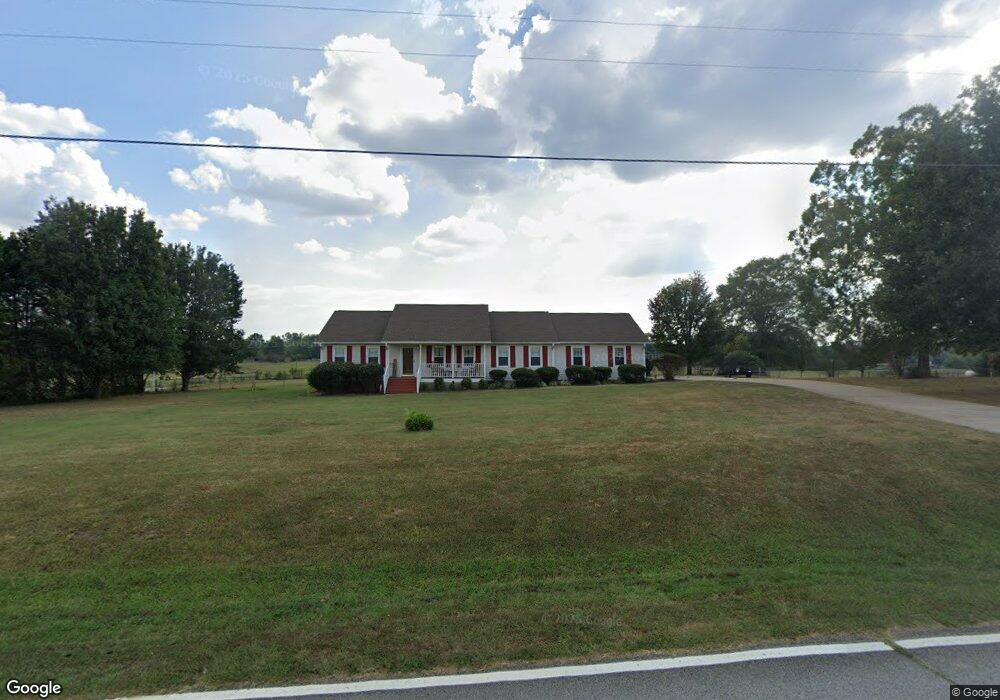
453 Willie Walker Rd Carrollton, GA 30117
Estimated Value: $307,000 - $354,000
3
Beds
2
Baths
1,823
Sq Ft
$180/Sq Ft
Est. Value
About This Home
This home is located at 453 Willie Walker Rd, Carrollton, GA 30117 and is currently estimated at $328,471, approximately $180 per square foot. 453 Willie Walker Rd is a home located in Carroll County with nearby schools including Central Elementary School, Central Middle School, and Central High School.
Ownership History
Date
Name
Owned For
Owner Type
Purchase Details
Closed on
Sep 27, 2024
Sold by
Bramble Michael Jordan
Bought by
Tomko Aaron Daniel
Current Estimated Value
Home Financials for this Owner
Home Financials are based on the most recent Mortgage that was taken out on this home.
Original Mortgage
$276,250
Outstanding Balance
$273,073
Interest Rate
6.35%
Mortgage Type
New Conventional
Estimated Equity
$55,398
Purchase Details
Closed on
Jan 11, 2024
Sold by
Bramble Janice
Bought by
Bramble Janice and Bramble David James
Purchase Details
Closed on
Apr 21, 2023
Sold by
Jones Donald Jeffrey
Bought by
Bramble Janice
Purchase Details
Closed on
Sep 21, 2020
Sold by
Branham Jo Ann Harrison Jo
Bought by
Jones Donald Jeffrey
Purchase Details
Closed on
Jan 22, 2010
Sold by
Branam Henry B and Branam Jo Ann
Bought by
Branam Jo Ann
Purchase Details
Closed on
Mar 2, 1998
Sold by
Bssm Lp
Bought by
Branam Henry B and Jo Ann
Create a Home Valuation Report for This Property
The Home Valuation Report is an in-depth analysis detailing your home's value as well as a comparison with similar homes in the area
Home Values in the Area
Average Home Value in this Area
Purchase History
| Date | Buyer | Sale Price | Title Company |
|---|---|---|---|
| Tomko Aaron Daniel | $325,000 | -- | |
| Bramble Janice | -- | -- | |
| Bramble Janice | $260,000 | -- | |
| Jones Donald Jeffrey | -- | -- | |
| Branam Jo Ann | -- | -- | |
| Branam Henry B | $12,500 | -- |
Source: Public Records
Mortgage History
| Date | Status | Borrower | Loan Amount |
|---|---|---|---|
| Open | Tomko Aaron Daniel | $276,250 |
Source: Public Records
Tax History Compared to Growth
Tax History
| Year | Tax Paid | Tax Assessment Tax Assessment Total Assessment is a certain percentage of the fair market value that is determined by local assessors to be the total taxable value of land and additions on the property. | Land | Improvement |
|---|---|---|---|---|
| 2024 | $611 | $104,085 | $8,471 | $95,614 |
| 2023 | $611 | $93,727 | $6,777 | $86,950 |
| 2022 | $1,680 | $74,290 | $4,518 | $69,772 |
| 2021 | $1,523 | $63,414 | $3,614 | $59,800 |
| 2020 | $288 | $55,862 | $3,286 | $52,576 |
| 2019 | $296 | $50,908 | $3,286 | $47,622 |
| 2018 | $295 | $43,763 | $3,071 | $40,692 |
| 2017 | $292 | $43,014 | $2,322 | $40,692 |
| 2016 | $292 | $43,014 | $2,322 | $40,692 |
| 2015 | $316 | $49,570 | $9,200 | $40,370 |
| 2014 | $319 | $49,570 | $9,200 | $40,370 |
Source: Public Records
Map
Nearby Homes
- 105 Woodbine Dr
- 345 Piney Grove Rd
- 399 Old Camp Church Rd
- 1531 Tyus Carrollton Rd
- 0 Bonner Rd Unit 10635754
- 0 Buffalo Creek Rd Unit 10624169
- 533 Buffalo Creek Rd
- 20 Camp Ct
- 95 Camp Ln
- 915 Oak Grove Rd
- The Coleman Plan at Summerfield Place
- The Pearson Plan at Summerfield Place
- The Piedmont Plan at Summerfield Place
- The Harrington Plan at Summerfield Place
- The McGinnis Plan at Summerfield Place
- The Telfair Plan at Summerfield Place
- 21 Crabapple Place
- 1585 Hays Mill Rd
- 40 Red Holly Gap
- 115 Greenwood Ln
- 463 Willie Walker Rd
- 0 Willie Walker Rd Unit 7356195
- 0 Willie Walker Rd
- 401 Willie Walker Rd
- 1049 Old Camp Church Rd
- 1067 Old Camp Church Rd
- 1079 Old Camp Church Rd
- 377 Willie Walker Rd
- 1091 Old Camp Church Rd
- 341 Willie Walker Rd
- 1124 Old Camp Church Rd
- 986 Old Camp Church Rd
- 145 S Lake Dr
- 427 Willie Walker Rd
- 1157 Old Camp Church Rd
- 85 S Lake Dr
- 35 S Lake Dr
- 34 Walker Lake Dr Unit 1
- 321 Willie Walker Rd Unit 26
- 321 Willie Walker Rd