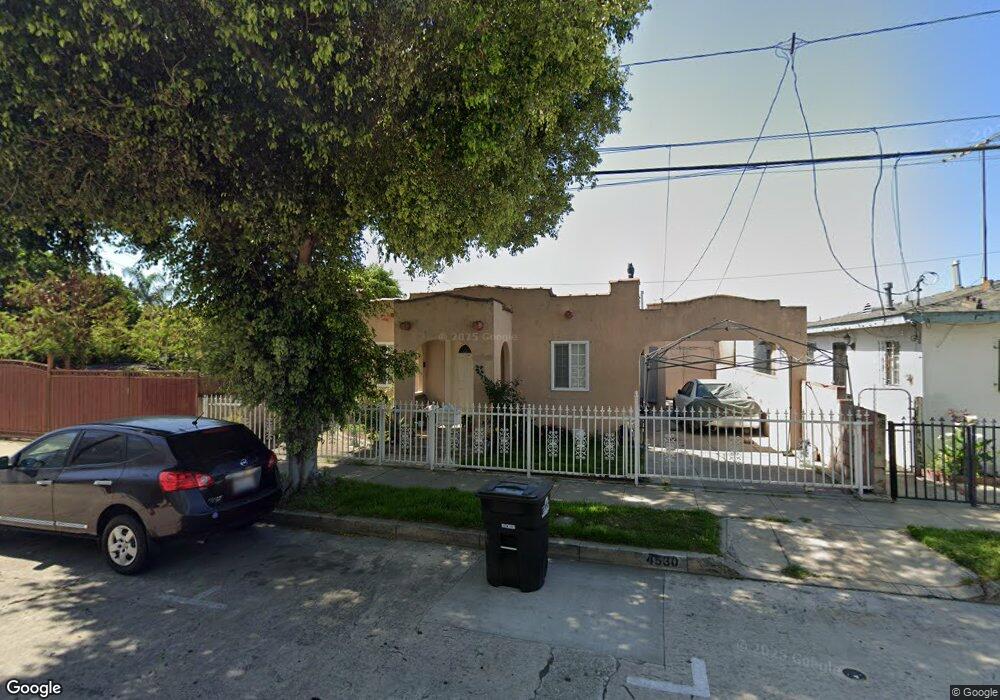
4530 E 52nd Dr Maywood, CA 90270
Estimated Value: $560,648 - $614,000
2
Beds
1
Bath
798
Sq Ft
$746/Sq Ft
Est. Value
About This Home
This home is located at 4530 E 52nd Dr, Maywood, CA 90270 and is currently estimated at $595,662, approximately $746 per square foot. 4530 E 52nd Dr is a home located in Los Angeles County with nearby schools including Maywood Elementary School, Chester W. Nimitz Middle School, and Maywood Academy High School.
Ownership History
Date
Name
Owned For
Owner Type
Purchase Details
Closed on
Jan 29, 2002
Sold by
Leyva Juan Jose
Bought by
Mendoza Jose A and Chavez Edelina
Current Estimated Value
Home Financials for this Owner
Home Financials are based on the most recent Mortgage that was taken out on this home.
Original Mortgage
$133,000
Outstanding Balance
$55,421
Interest Rate
7.17%
Estimated Equity
$540,241
Purchase Details
Closed on
Oct 23, 1997
Sold by
Hud
Bought by
Leyva Juan Jose and Leyva Josefina
Home Financials for this Owner
Home Financials are based on the most recent Mortgage that was taken out on this home.
Original Mortgage
$88,542
Interest Rate
7.16%
Mortgage Type
FHA
Purchase Details
Closed on
May 15, 1997
Sold by
Filgueres Antonio
Bought by
Countrywide Home Loans Inc
Purchase Details
Closed on
Apr 22, 1997
Sold by
Countrywide Home Loans Inc
Bought by
Hud
Purchase Details
Closed on
Sep 30, 1995
Sold by
Contreras Ramon
Bought by
Filgueres Antonio and Filgueres Maria D
Create a Home Valuation Report for This Property
The Home Valuation Report is an in-depth analysis detailing your home's value as well as a comparison with similar homes in the area
Home Values in the Area
Average Home Value in this Area
Purchase History
| Date | Buyer | Sale Price | Title Company |
|---|---|---|---|
| Mendoza Jose A | $133,000 | Fidelity National Title Co | |
| Leyva Juan Jose | $90,000 | -- | |
| Countrywide Home Loans Inc | $137,488 | -- | |
| Hud | -- | Landsafe Title | |
| Filgueres Antonio | -- | -- |
Source: Public Records
Mortgage History
| Date | Status | Borrower | Loan Amount |
|---|---|---|---|
| Open | Mendoza Jose A | $133,000 | |
| Previous Owner | Leyva Juan Jose | $88,542 |
Source: Public Records
Tax History
| Year | Tax Paid | Tax Assessment Tax Assessment Total Assessment is a certain percentage of the fair market value that is determined by local assessors to be the total taxable value of land and additions on the property. | Land | Improvement |
|---|---|---|---|---|
| 2025 | $2,918 | $196,451 | $154,512 | $41,939 |
| 2024 | $2,918 | $192,600 | $151,483 | $41,117 |
| 2023 | $2,867 | $188,824 | $148,513 | $40,311 |
| 2022 | $2,750 | $185,122 | $145,601 | $39,521 |
| 2021 | $2,713 | $181,494 | $142,747 | $38,747 |
| 2019 | $2,627 | $176,113 | $138,514 | $37,599 |
| 2018 | $2,556 | $172,661 | $135,799 | $36,862 |
| 2016 | $2,376 | $165,959 | $130,527 | $35,432 |
| 2015 | $2,242 | $163,467 | $128,567 | $34,900 |
| 2014 | $2,240 | $160,266 | $126,049 | $34,217 |
Source: Public Records
Map
Nearby Homes
- 4539 E 53rd St
- 5606 Pine Ave
- 4313 E 55th St
- 5824 Heliotrope Ave
- 5202 Gifford Ave
- 4212 E 58th St
- 4101 E 57th St
- 4301 E 60th St
- 6033 Clarkson Ave
- 3800 E 57th St
- 3738 E 53rd St
- 6122 Wilcox Ave
- 3725 E 57th St
- 6152 Wilcox Ave
- 6011 Bear Ave
- 5115 Loma Vista Ave
- 5362 E Slauson Ave
- 4610 Leonis St
- 4633 Leonis St
- 3519 E 60th St
- 4526 E 52nd Dr
- 4537 E 52nd Place
- 4533 E 52nd Place
- 4529 E 52nd Place
- 4520 E 52nd Dr
- 4542 E 52nd Dr
- 4525 E 52nd Place
- 4541 E 52nd Place
- 4546 E 52nd Dr
- 4521 E 52nd Place
- 4545 E 52nd Place
- 4550 E 52nd Dr
- 4513 E 52nd Place
- 4554 E 52nd Dr
- 4553 E 52nd Place
- 4532 E 52nd Place
- 4528 E 52nd Place
- 4538 E 52nd Place
- 4524 E 52nd Place
- 4558 E 52nd Dr
Your Personal Tour Guide
Ask me questions while you tour the home.