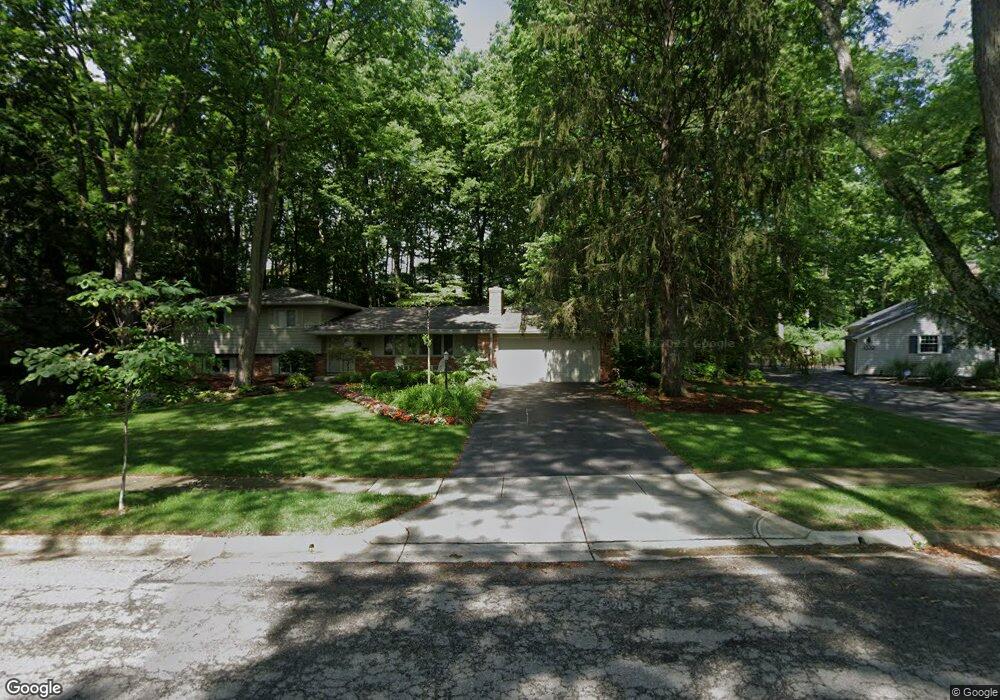
4530 Langport Rd Columbus, OH 43220
Estimated Value: $658,000 - $913,000
4
Beds
4
Baths
2,458
Sq Ft
$306/Sq Ft
Est. Value
About This Home
This home is located at 4530 Langport Rd, Columbus, OH 43220 and is currently estimated at $751,365, approximately $305 per square foot. 4530 Langport Rd is a home located in Franklin County with nearby schools including Windermere Elementary School, Hastings Middle School, and Upper Arlington High School.
Ownership History
Date
Name
Owned For
Owner Type
Purchase Details
Closed on
Apr 25, 2008
Sold by
Clinger Thomas Jana and Thomas Stephen D
Bought by
Snedaker Karen L and Snedaker Sharon Jeffrey
Current Estimated Value
Home Financials for this Owner
Home Financials are based on the most recent Mortgage that was taken out on this home.
Original Mortgage
$225,000
Outstanding Balance
$135,728
Interest Rate
4.99%
Mortgage Type
Purchase Money Mortgage
Estimated Equity
$615,637
Purchase Details
Closed on
Aug 17, 2001
Sold by
Dabate Diane
Bought by
Clinger Jana D
Home Financials for this Owner
Home Financials are based on the most recent Mortgage that was taken out on this home.
Original Mortgage
$313,000
Interest Rate
7.25%
Mortgage Type
Purchase Money Mortgage
Purchase Details
Closed on
Aug 19, 1994
Sold by
Kornacker Melodee S
Bought by
Kenneth F Vlah and D'Abte Diane C
Home Financials for this Owner
Home Financials are based on the most recent Mortgage that was taken out on this home.
Original Mortgage
$248,800
Interest Rate
5.5%
Mortgage Type
New Conventional
Create a Home Valuation Report for This Property
The Home Valuation Report is an in-depth analysis detailing your home's value as well as a comparison with similar homes in the area
Home Values in the Area
Average Home Value in this Area
Purchase History
| Date | Buyer | Sale Price | Title Company |
|---|---|---|---|
| Snedaker Karen L | $375,000 | Talon Group | |
| Clinger Jana D | $329,500 | Chicago Title | |
| Kenneth F Vlah | $311,000 | -- |
Source: Public Records
Mortgage History
| Date | Status | Borrower | Loan Amount |
|---|---|---|---|
| Open | Snedaker Karen L | $225,000 | |
| Previous Owner | Clinger Jana D | $313,000 | |
| Previous Owner | Kenneth F Vlah | $248,800 |
Source: Public Records
Tax History Compared to Growth
Tax History
| Year | Tax Paid | Tax Assessment Tax Assessment Total Assessment is a certain percentage of the fair market value that is determined by local assessors to be the total taxable value of land and additions on the property. | Land | Improvement |
|---|---|---|---|---|
| 2024 | $11,718 | $202,410 | $88,550 | $113,860 |
| 2023 | $11,573 | $202,405 | $88,550 | $113,855 |
| 2022 | $12,129 | $173,570 | $65,840 | $107,730 |
| 2021 | $10,737 | $173,570 | $65,840 | $107,730 |
| 2020 | $10,642 | $173,570 | $65,840 | $107,730 |
| 2019 | $10,010 | $144,350 | $65,840 | $78,510 |
| 2018 | $9,602 | $144,350 | $65,840 | $78,510 |
| 2017 | $9,596 | $144,350 | $65,840 | $78,510 |
| 2016 | $9,259 | $140,040 | $52,710 | $87,330 |
| 2015 | $9,251 | $140,040 | $52,710 | $87,330 |
| 2014 | $9,262 | $140,040 | $52,710 | $87,330 |
| 2013 | $4,422 | $127,295 | $47,915 | $79,380 |
Source: Public Records
Map
Nearby Homes
- 4540 Langport Rd
- 2681 Lane Rd
- 4371 Latin Ln Unit 122
- 4270 Llanfair Ct
- 4390 Dublin Rd
- 4450 Haverford Ct
- 3055 Carriage Ln
- 4400 Dublin Rd
- 3950 Riverside Dr
- 2231 Atlee Ct Unit 12
- 4025 Dublin Rd
- 4765 Coach Rd
- 3320 Scioto Run Blvd
- 2198 Sandston Rd
- 4115 Woodbridge Rd
- 5000 Slate Run Woods Ct
- 2165 Partlow Dr
- 3959 Woodbridge Rd
- 3830 Riverview Dr
- 2300 Hoxton Ct
- 4520 Langport Rd
- 4551 Lanes End St
- 4556 Langport Rd
- 4525 Langport Rd
- 4541 Langport Rd
- 4500 Langport Rd
- 4561 Lanes End St
- 4501 Langport Rd
- 4566 Langport Rd
- 2770 Helston Rd
- 2684 Haverford Rd
- 4490 Langport Rd
- 2721 Lane Rd
- 2690 Haverford Rd
- 4530 Tetford Rd
- 4556 Lanes End St
- 4540 Tetford Rd
- 2665 Lane Rd
- 2786 Helston Rd
- 4580 Langport Rd