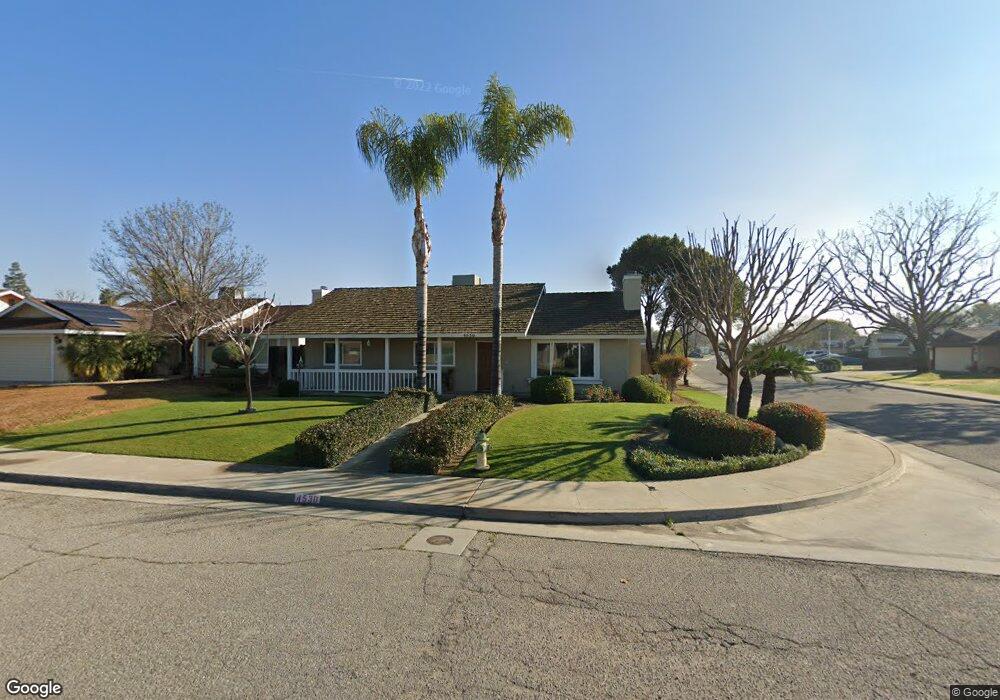
4530 Marlow Ct Bakersfield, CA 93308
Highland Knolls NeighborhoodEstimated Value: $316,951 - $365,000
3
Beds
2
Baths
1,277
Sq Ft
$264/Sq Ft
Est. Value
About This Home
This home is located at 4530 Marlow Ct, Bakersfield, CA 93308 and is currently estimated at $336,738, approximately $263 per square foot. 4530 Marlow Ct is a home located in Kern County with nearby schools including Highland Elementary School, Standard Middle School, and North High School.
Ownership History
Date
Name
Owned For
Owner Type
Purchase Details
Closed on
Oct 9, 2025
Sold by
Gonzalez Haverd V
Bought by
New American Funding Llc
Current Estimated Value
Purchase Details
Closed on
Aug 14, 2025
Sold by
Gonzalez Nicole
Bought by
Gonzalez Haverd V
Purchase Details
Closed on
Jul 30, 2025
Sold by
James A Ash 2019 Revocable Trust and Harmel Janet
Bought by
Gonzalez Haverd V
Purchase Details
Closed on
Aug 8, 2019
Sold by
Ash James and Ash James A
Bought by
Ash James and The James A Ash 2019 Revocable
Purchase Details
Closed on
Mar 19, 2001
Sold by
Burks Bradley C and Burks Bradley
Bought by
Ash James A and Ash Doris R
Home Financials for this Owner
Home Financials are based on the most recent Mortgage that was taken out on this home.
Original Mortgage
$75,200
Interest Rate
7.19%
Purchase Details
Closed on
Sep 30, 1996
Sold by
Burks Kathryn
Bought by
Burks Bradley
Purchase Details
Closed on
May 12, 1995
Sold by
Hud
Bought by
Burks Bradley C and Burks Kathryn D
Home Financials for this Owner
Home Financials are based on the most recent Mortgage that was taken out on this home.
Original Mortgage
$90,286
Interest Rate
8.43%
Mortgage Type
FHA
Purchase Details
Closed on
Dec 14, 1994
Sold by
Rousseau Mtg Corp
Bought by
Hud
Purchase Details
Closed on
Sep 29, 1994
Sold by
Mccormick Robby and Mccormick Shawna
Bought by
Rousseau Mtg Corp
Create a Home Valuation Report for This Property
The Home Valuation Report is an in-depth analysis detailing your home's value as well as a comparison with similar homes in the area
Home Values in the Area
Average Home Value in this Area
Purchase History
| Date | Buyer | Sale Price | Title Company |
|---|---|---|---|
| New American Funding Llc | -- | Placer Title | |
| Gonzalez Haverd V | -- | Placer Title | |
| Gonzalez Haverd V | $345,000 | Placer Title | |
| Ash James | -- | None Available | |
| Ash James A | $94,000 | Fidelity National Title Co | |
| Burks Bradley | -- | -- | |
| Burks Bradley C | $88,500 | Heritage Title Co | |
| Hud | -- | Fidelity National Title Ins | |
| Rousseau Mtg Corp | $96,110 | Stewart Title |
Source: Public Records
Mortgage History
| Date | Status | Borrower | Loan Amount |
|---|---|---|---|
| Previous Owner | Ash James A | $75,200 | |
| Previous Owner | Burks Bradley C | $90,286 |
Source: Public Records
Tax History
| Year | Tax Paid | Tax Assessment Tax Assessment Total Assessment is a certain percentage of the fair market value that is determined by local assessors to be the total taxable value of land and additions on the property. | Land | Improvement |
|---|---|---|---|---|
| 2025 | $2,594 | $141,618 | $30,125 | $111,493 |
| 2024 | $2,594 | $138,842 | $29,535 | $109,307 |
| 2023 | $2,504 | $136,120 | $28,956 | $107,164 |
| 2022 | $2,420 | $133,452 | $28,389 | $105,063 |
| 2021 | $2,327 | $130,836 | $27,833 | $103,003 |
| 2020 | $2,237 | $129,495 | $27,548 | $101,947 |
| 2019 | $2,207 | $129,495 | $27,548 | $101,947 |
| 2018 | $2,134 | $124,469 | $26,479 | $97,990 |
| 2017 | $2,117 | $122,029 | $25,960 | $96,069 |
| 2016 | $1,951 | $119,637 | $25,451 | $94,186 |
| 2015 | $1,922 | $117,841 | $25,069 | $92,772 |
| 2014 | $1,870 | $115,533 | $24,578 | $90,955 |
Source: Public Records
Map
Nearby Homes
- 913 Mcginley Ave
- 4413 Mccray St
- 348 Petrol Rd Unit 394
- 348 Petrol Rd Unit 366
- 4224 Orrick Ct
- 376 Petrol Rd
- 4218 Orrick Ct
- 900 James Rd Unit 11
- 900 James Rd Unit 17
- 4607 Skye Dr
- 4501 Knoll Dr
- 514 Blue Meadow Ct
- 33 Tee Ln
- 4512 Skye Dr
- 4884 Greenview Ln
- 4824 Greenview Ln
- 65 Eagle Ln
- 9 Tee Ln
- 43 Divot Ln
- 4873 Putter Ln
- 4538 Marlow Ct
- 4600 Marlow Ct
- 4531 Mcginnis St
- 4539 Mcginnis St
- 1019 Mcginley Ave
- 1100 Mcginley Ave
- 1013 Mcginley Ave
- 1025 Mcginley Ave
- 1100 Mc Ginley Ave
- 4543 Mcginnis St
- 1031 Mcginley Ave
- 1007 Mcginley Ave
- 1106 Mcginley Ave
- 4601 Mcginnis St
- 4601 Marlow Ct
- 1101 Mc Ginley Ave
- 1101 Mcginley Ave
- 4608 Marlow Ct
- 4605 Marlow Ct
- 4607 Mcginnis St
Your Personal Tour Guide
Ask me questions while you tour the home.