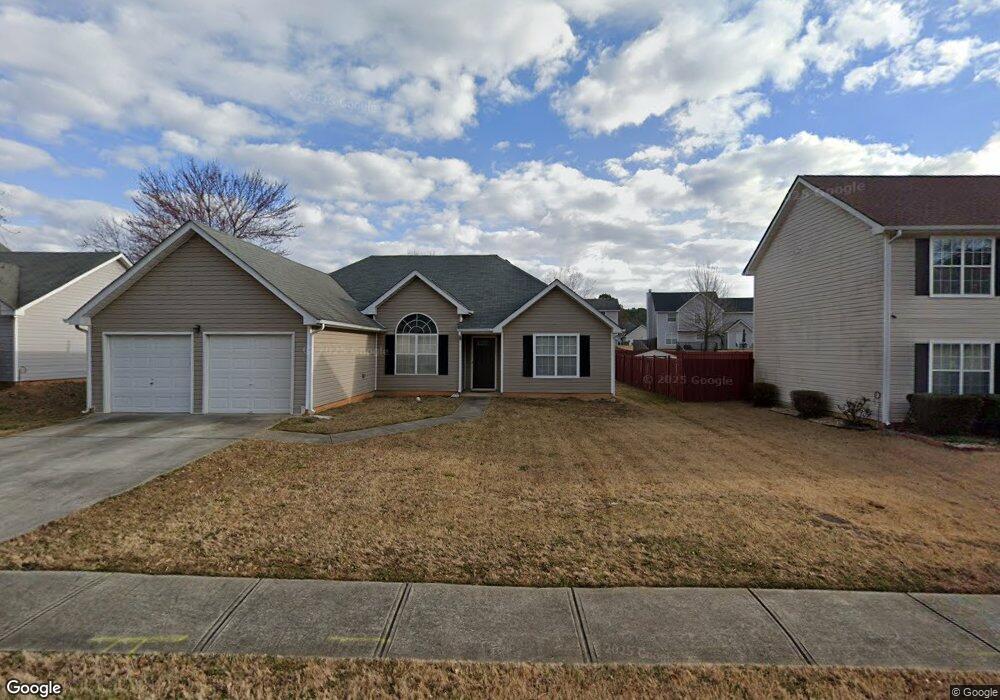
4530 Millenium View Ct Snellville, GA 30039
Estimated Value: $290,000 - $314,000
3
Beds
2
Baths
1,508
Sq Ft
$200/Sq Ft
Est. Value
About This Home
This home is located at 4530 Millenium View Ct, Snellville, GA 30039 and is currently estimated at $300,989, approximately $199 per square foot. 4530 Millenium View Ct is a home located in Gwinnett County with nearby schools including Rosebud Elementary School, Grace Snell Middle School, and South Gwinnett High School.
Ownership History
Date
Name
Owned For
Owner Type
Purchase Details
Closed on
Aug 24, 2010
Sold by
Federal Home Loan Mortgage Corporation
Bought by
Rogers Angela
Current Estimated Value
Home Financials for this Owner
Home Financials are based on the most recent Mortgage that was taken out on this home.
Original Mortgage
$85,838
Outstanding Balance
$57,126
Interest Rate
4.75%
Mortgage Type
FHA
Estimated Equity
$243,863
Purchase Details
Closed on
Jun 1, 2010
Sold by
Gmac Mtg Llc
Bought by
Federal Home Loan Mortgage Corporation
Purchase Details
Closed on
Apr 15, 2002
Sold by
Ellenwood Dev Co Inc
Bought by
Tate Daphne M
Home Financials for this Owner
Home Financials are based on the most recent Mortgage that was taken out on this home.
Original Mortgage
$116,050
Interest Rate
7.12%
Mortgage Type
FHA
Create a Home Valuation Report for This Property
The Home Valuation Report is an in-depth analysis detailing your home's value as well as a comparison with similar homes in the area
Home Values in the Area
Average Home Value in this Area
Purchase History
| Date | Buyer | Sale Price | Title Company |
|---|---|---|---|
| Rogers Angela | -- | -- | |
| Federal Home Loan Mortgage Corporation | -- | -- | |
| Gmac Mtg Llc | $101,000 | -- | |
| Tate Daphne M | $117,900 | -- |
Source: Public Records
Mortgage History
| Date | Status | Borrower | Loan Amount |
|---|---|---|---|
| Open | Rogers Angela | $85,838 | |
| Previous Owner | Tate Daphne M | $116,050 |
Source: Public Records
Tax History
| Year | Tax Paid | Tax Assessment Tax Assessment Total Assessment is a certain percentage of the fair market value that is determined by local assessors to be the total taxable value of land and additions on the property. | Land | Improvement |
|---|---|---|---|---|
| 2025 | $3,118 | $113,880 | $19,800 | $94,080 |
| 2024 | $3,246 | $114,440 | $19,800 | $94,640 |
| 2023 | $3,246 | $102,640 | $27,080 | $75,560 |
| 2022 | $2,846 | $96,920 | $20,000 | $76,920 |
| 2021 | $2,345 | $71,400 | $16,000 | $55,400 |
| 2020 | $2,209 | $64,400 | $14,000 | $50,400 |
| 2019 | $2,011 | $58,040 | $12,800 | $45,240 |
| 2018 | $1,930 | $54,440 | $11,200 | $43,240 |
| 2016 | $1,755 | $46,600 | $8,000 | $38,600 |
| 2015 | $1,325 | $34,040 | $8,000 | $26,040 |
| 2014 | $1,330 | $34,040 | $8,000 | $26,040 |
Source: Public Records
Map
Nearby Homes
- 4655 Millenium View Ct
- 4729 Score Ct
- 3251 Lenora Church Rd
- 4720 Duration Ct
- 4615 Duration Ct
- 3331 Metro Way
- 4821 Lenora Church Rd
- 4067 Rosebud Park Dr
- 4479 Alpine Ct
- 96 Pleasant Hill Rd NW
- 3807 Rosebud Park Dr
- 3660 Ivy Cottage Dr
- 3670 Ivy Cottage Dr
- 3670 Ivy Cottage Dr Unit 40B
- 3437 Iron Hearth Bend Unit 120A
- 3437 Iron Hearth Bend
- 3680 Ivy Cottage Dr Unit 39B
- 3680 Ivy Cottage Dr
- 3447 Iron Hearth Bend
- 3447 Iron Hearth Bend Unit 119A
- 4520 Millenium View Ct SW
- 4520 Millenium View Ct
- 4540 Millenium View Ct
- 4500 Millenium View Ct
- 4759 Centurian Way View
- 4550 Millenium View Ct
- 4769 Centurian Way View
- 4525 Millenium View Ct SW
- 4749 Centurian Way View
- 4779 Centurian Way View
- 4525 Millenium View Ct
- 4535 Millenium View Ct
- 4515 Millenium View Ct
- 4490 Millenium View Ct
- 4789 Centurian Way View
- 4545 Millenium View Ct
- 4739 Centurian Way
- 4739 Centurian Way View
- 4560 Millenium View Ct
- 4505 Millenium View Ct
Your Personal Tour Guide
Ask me questions while you tour the home.