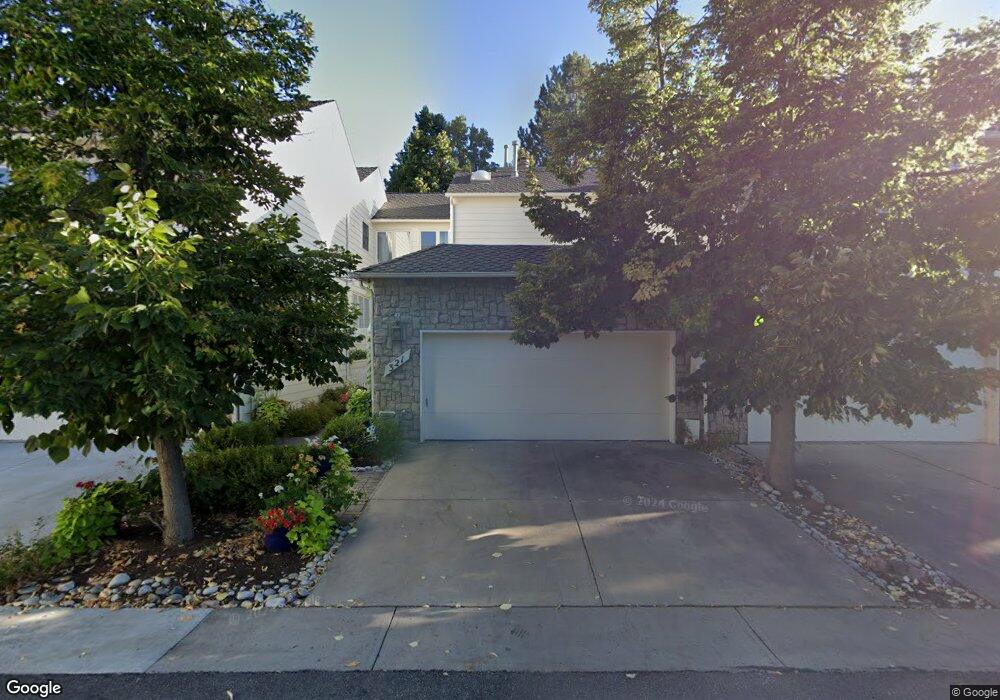
4530 S Verbena St Unit 333 Denver, CO 80237
Hampden South NeighborhoodEstimated Value: $750,000 - $868,000
2
Beds
3
Baths
3,840
Sq Ft
$213/Sq Ft
Est. Value
About This Home
This home is located at 4530 S Verbena St Unit 333, Denver, CO 80237 and is currently estimated at $817,431, approximately $212 per square foot. 4530 S Verbena St Unit 333 is a home located in Denver County with nearby schools including Samuels Elementary School, Holm Elementary School, and Joe Shoemaker School.
Ownership History
Date
Name
Owned For
Owner Type
Purchase Details
Closed on
Oct 4, 2022
Sold by
Weiner Lori E
Bought by
Cantwell Michael A and Cantwell Susan
Current Estimated Value
Purchase Details
Closed on
May 23, 2017
Sold by
4530 South Verbena Llc
Bought by
Weiner Lori E
Home Financials for this Owner
Home Financials are based on the most recent Mortgage that was taken out on this home.
Original Mortgage
$350,000
Interest Rate
4.08%
Mortgage Type
New Conventional
Purchase Details
Closed on
Apr 30, 2015
Sold by
Dal Sharilyn D
Bought by
4530 South Verbena Llc
Home Financials for this Owner
Home Financials are based on the most recent Mortgage that was taken out on this home.
Original Mortgage
$307,810
Interest Rate
3.73%
Mortgage Type
Purchase Money Mortgage
Purchase Details
Closed on
Mar 5, 2012
Sold by
Yoder D Virginia
Bought by
Kal Sharilyn D
Create a Home Valuation Report for This Property
The Home Valuation Report is an in-depth analysis detailing your home's value as well as a comparison with similar homes in the area
Home Values in the Area
Average Home Value in this Area
Purchase History
| Date | Buyer | Sale Price | Title Company |
|---|---|---|---|
| Cantwell Michael A | $821,000 | -- | |
| Weiner Lori E | $625,000 | First American | |
| 4530 South Verbena Llc | -- | None Available | |
| Kal Sharilyn D | $357,250 | Land Title Guarantee Company |
Source: Public Records
Mortgage History
| Date | Status | Borrower | Loan Amount |
|---|---|---|---|
| Previous Owner | Weiner Lori E | $350,000 | |
| Previous Owner | 4530 South Verbena Llc | $307,810 |
Source: Public Records
Tax History Compared to Growth
Tax History
| Year | Tax Paid | Tax Assessment Tax Assessment Total Assessment is a certain percentage of the fair market value that is determined by local assessors to be the total taxable value of land and additions on the property. | Land | Improvement |
|---|---|---|---|---|
| 2024 | $3,752 | $47,370 | $3,010 | $44,360 |
| 2023 | $3,671 | $47,370 | $3,010 | $44,360 |
| 2022 | $3,304 | $41,550 | $3,120 | $38,430 |
| 2021 | $3,189 | $42,740 | $3,210 | $39,530 |
| 2020 | $3,443 | $46,400 | $3,210 | $43,190 |
| 2019 | $3,346 | $46,400 | $3,210 | $43,190 |
| 2018 | $3,119 | $40,310 | $2,160 | $38,150 |
| 2017 | $2,579 | $33,440 | $2,160 | $31,280 |
| 2016 | $2,988 | $36,640 | $1,910 | $34,730 |
| 2015 | $2,863 | $36,640 | $1,910 | $34,730 |
| 2014 | $2,158 | $25,980 | $2,945 | $23,035 |
Source: Public Records
Map
Nearby Homes
- 4530 S Verbena St Unit 309
- 4675 S Yosemite St Unit 205
- 4505 S Yosemite St Unit 115
- 4505 S Yosemite St Unit 106
- 4505 S Yosemite St Unit 371
- 4505 S Yosemite St Unit 433
- 4605 S Yosemite St Unit C-304
- 4605 S Yosemite St Unit 25
- 4605 S Yosemite St Unit 44
- 4605 S Yosemite St Unit C-301
- 4605 S Yosemite St Unit 36
- 8364 E Radcliff Ave Unit 398
- 8764 E Radcliff Ave
- 8590 E Temple Dr
- 8505 E Temple Dr Unit 503
- 8505 E Temple Dr Unit 501
- 8505 E Temple Dr Unit 513
- 8505 E Temple Dr Unit 473
- 4708 S Willow St
- 4504 S Akron St
- 4530 S Verbena St Unit 311
- 4530 S Verbena St Unit 310
- 4530 S Verbena St Unit 308
- 4530 S Verbena St Unit 307
- 4530 S Verbena St Unit 306
- 4530 S Verbena St Unit 381
- 4530 S Verbena St Unit 380
- 4530 S Verbena St Unit 324
- 4530 S Verbena St Unit 323
- 4530 S Verbena St Unit 322
- 4530 S Verbena St Unit 321
- 4530 S Verbena St Unit 320
- 4530 S Verbena St Unit 319
- 4530 S Verbena St Unit 318
- 4530 S Verbena St Unit 315
- 4530 S Verbena St Unit 337
- 4530 S Verbena St Unit 336
- 4530 S Verbena St Unit 334
- 4530 S Verbena St Unit 331
- 4530 S Verbena St Unit 330