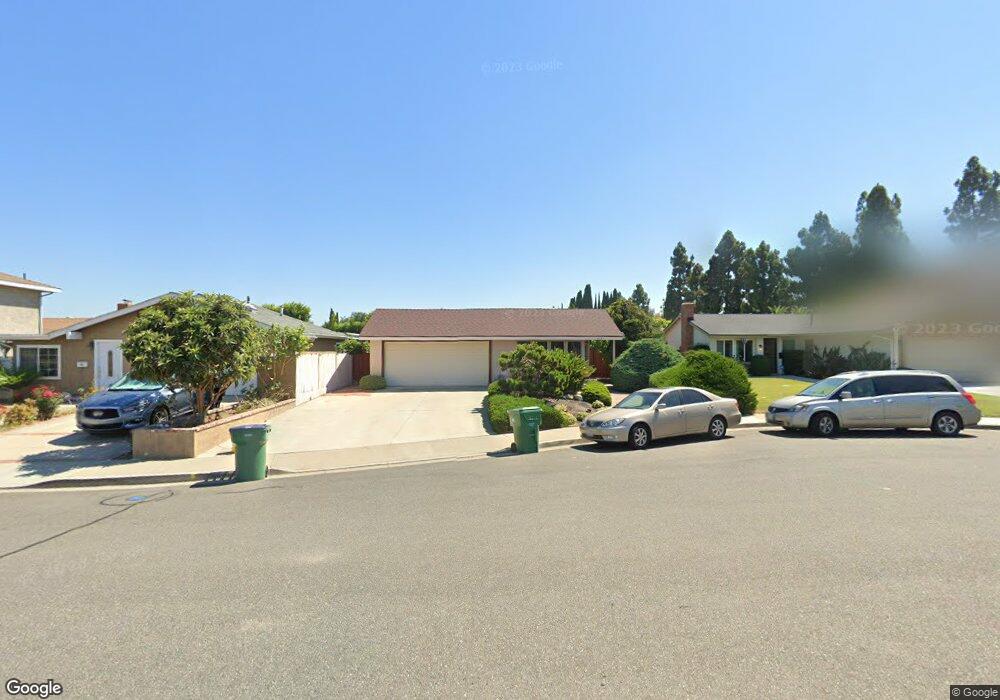
4531 Charleville Cir Irvine, CA 92604
Walnut NeighborhoodEstimated Value: $1,212,783 - $1,393,000
4
Beds
2
Baths
1,324
Sq Ft
$993/Sq Ft
Est. Value
About This Home
This home is located at 4531 Charleville Cir, Irvine, CA 92604 and is currently estimated at $1,314,946, approximately $993 per square foot. 4531 Charleville Cir is a home located in Orange County with nearby schools including Greentree Elementary School, Venado Middle School, and Irvine High School.
Ownership History
Date
Name
Owned For
Owner Type
Purchase Details
Closed on
Jan 19, 2013
Sold by
Hoang Nhan V and Hoang Nghia T
Bought by
Hoang Duc Ngoc and Bui Hanh Diem
Current Estimated Value
Purchase Details
Closed on
Jul 29, 2005
Sold by
Hoang Nhan V and Hoang Nghia T
Bought by
Hoang Nghia T and Hoang Nhan V
Purchase Details
Closed on
Aug 20, 2004
Sold by
Hoang Nghia T and Hoang Nhan V
Bought by
Hoang Nhan V and Hoang Nghia T
Home Financials for this Owner
Home Financials are based on the most recent Mortgage that was taken out on this home.
Original Mortgage
$144,500
Outstanding Balance
$71,418
Interest Rate
5.95%
Mortgage Type
New Conventional
Estimated Equity
$1,243,528
Purchase Details
Closed on
Sep 16, 1993
Sold by
Hoang Nghia T
Bought by
Hoang Nghia T and Hoang Nhan V
Home Financials for this Owner
Home Financials are based on the most recent Mortgage that was taken out on this home.
Original Mortgage
$163,000
Interest Rate
6.81%
Create a Home Valuation Report for This Property
The Home Valuation Report is an in-depth analysis detailing your home's value as well as a comparison with similar homes in the area
Home Values in the Area
Average Home Value in this Area
Purchase History
| Date | Buyer | Sale Price | Title Company |
|---|---|---|---|
| Hoang Duc Ngoc | -- | None Available | |
| Hoang Nghia T | -- | -- | |
| Hoang Nhan V | -- | Fidelity National Title Co | |
| Hoang Nghia T | -- | Stewart Title |
Source: Public Records
Mortgage History
| Date | Status | Borrower | Loan Amount |
|---|---|---|---|
| Open | Hoang Nhan V | $144,500 | |
| Closed | Hoang Nghia T | $163,000 |
Source: Public Records
Tax History
| Year | Tax Paid | Tax Assessment Tax Assessment Total Assessment is a certain percentage of the fair market value that is determined by local assessors to be the total taxable value of land and additions on the property. | Land | Improvement |
|---|---|---|---|---|
| 2025 | $5,616 | $531,809 | $426,521 | $105,288 |
| 2024 | $5,616 | $521,382 | $418,158 | $103,224 |
| 2023 | $5,471 | $511,159 | $409,959 | $101,200 |
| 2022 | $5,365 | $501,137 | $401,921 | $99,216 |
| 2021 | $5,241 | $491,311 | $394,040 | $97,271 |
| 2020 | $5,212 | $486,274 | $390,000 | $96,274 |
| 2019 | $5,097 | $476,740 | $382,353 | $94,387 |
| 2018 | $5,006 | $467,393 | $374,856 | $92,537 |
| 2017 | $4,903 | $458,229 | $367,506 | $90,723 |
| 2016 | $4,688 | $449,245 | $360,300 | $88,945 |
| 2015 | $4,619 | $442,497 | $354,888 | $87,609 |
| 2014 | $4,530 | $433,830 | $347,937 | $85,893 |
Source: Public Records
Map
Nearby Homes
- 14592 Highcrest Cir
- 10 Santa fe Unit 38
- 14701 Doncaster Rd
- 12 Silverwood Unit 19
- 4862 Gainsport Cir
- 26 Helena Unit 69
- 32 Goldenbush
- 10 Goldenbush Unit 36
- 54 Kazan St
- 45 Golden Glen St Unit 75
- 10 Raleigh
- 127 Huntington Unit 257
- 83 Huntington Unit 278
- 65 Remington Unit 232
- 7 Timberline
- 3 Wintergreen Unit 7
- 5 Poinsettia
- 66 Bridgeport
- 10 Poinsettia
- 14232 Matisse Ave
- 4521 Charleville Cir
- 4541 Charleville Cir
- 4532 Wyngate Cir
- 4542 Wyngate Cir
- 4551 Charleville Cir
- 4522 Wyngate Cir
- 4512 Wyngate Cir
- 4501 Charleville Cir
- 4552 Wyngate Cir
- 4532 Charleville Cir
- 4522 Charleville Cir
- 4502 Wyngate Cir
- 4542 Charleville Cir
- 4552 Charleville Cir
- 4512 Charleville Cir
- 4491 Charleville Cir
- 4561 Kimberwick Cir
- 4492 Wyngate Cir
- 4502 Charleville Cir
- 4481 Charleville Cir
Your Personal Tour Guide
Ask me questions while you tour the home.