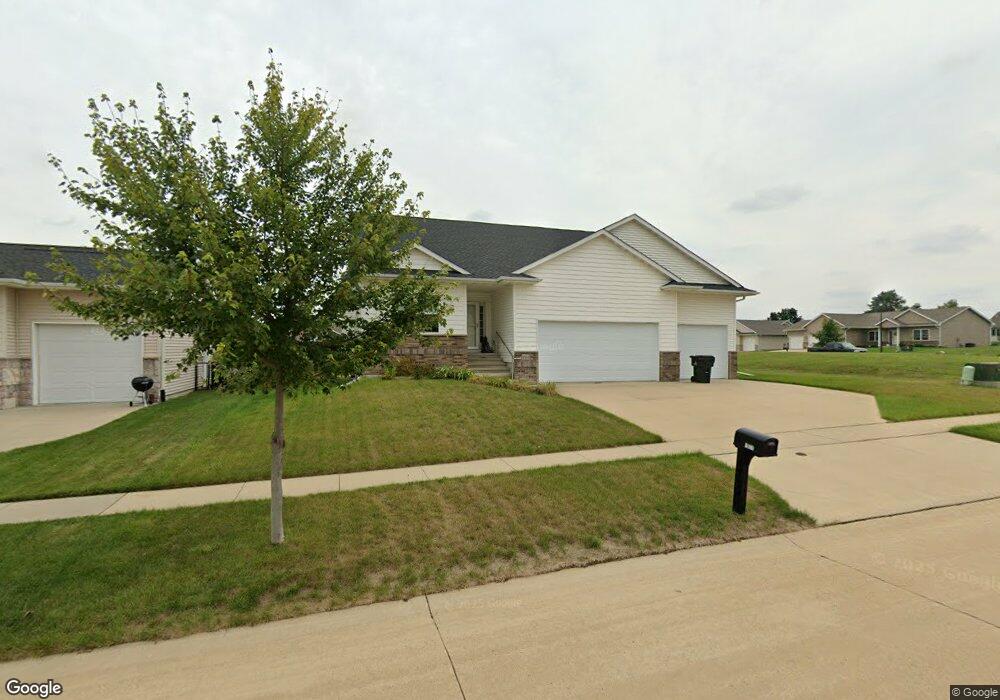
4531 Holly Cir NE Cedar Rapids, IA 52411
Estimated Value: $390,000 - $468,000
4
Beds
4
Baths
1,677
Sq Ft
$251/Sq Ft
Est. Value
About This Home
This home is located at 4531 Holly Cir NE, Cedar Rapids, IA 52411 and is currently estimated at $420,838, approximately $250 per square foot. 4531 Holly Cir NE is a home located in Linn County with nearby schools including Viola Gibson Elementary School, Ponderosa Elementary School, and Harding Middle School.
Ownership History
Date
Name
Owned For
Owner Type
Purchase Details
Closed on
Jun 17, 2016
Sold by
Thurston Noreen M
Bought by
Heistand James L and Bridge Stephanie J
Current Estimated Value
Purchase Details
Closed on
Jun 30, 2014
Sold by
Thurston Charles S and Thurston Chip
Bought by
Thurston Noreen M
Purchase Details
Closed on
Jun 1, 2009
Sold by
Meyer Alan R and Raffaelli Meyer Donna
Bought by
Thurston Charles and Thurston Noreen
Home Financials for this Owner
Home Financials are based on the most recent Mortgage that was taken out on this home.
Original Mortgage
$266,912
Interest Rate
4.83%
Mortgage Type
Purchase Money Mortgage
Purchase Details
Closed on
Mar 2, 2009
Sold by
Alan Meyer Enterprises Lc
Bought by
Meyer Alan R and Raffaelli Meyer Donna
Home Financials for this Owner
Home Financials are based on the most recent Mortgage that was taken out on this home.
Original Mortgage
$219,900
Interest Rate
5.14%
Mortgage Type
Commercial
Create a Home Valuation Report for This Property
The Home Valuation Report is an in-depth analysis detailing your home's value as well as a comparison with similar homes in the area
Home Values in the Area
Average Home Value in this Area
Purchase History
| Date | Buyer | Sale Price | Title Company |
|---|---|---|---|
| Heistand James L | -- | None Available | |
| Thurston Noreen M | -- | None Available | |
| Thurston Charles | $280,500 | None Available | |
| Meyer Alan R | $62,500 | None Available |
Source: Public Records
Mortgage History
| Date | Status | Borrower | Loan Amount |
|---|---|---|---|
| Previous Owner | Thurston Charles | $266,912 | |
| Previous Owner | Meyer Alan R | $219,900 |
Source: Public Records
Tax History Compared to Growth
Tax History
| Year | Tax Paid | Tax Assessment Tax Assessment Total Assessment is a certain percentage of the fair market value that is determined by local assessors to be the total taxable value of land and additions on the property. | Land | Improvement |
|---|---|---|---|---|
| 2025 | $6,804 | $414,000 | $76,000 | $338,000 |
| 2024 | $7,020 | $394,900 | $72,000 | $322,900 |
| 2023 | $7,020 | $394,900 | $72,000 | $322,900 |
| 2022 | $6,238 | $341,700 | $62,000 | $279,700 |
| 2021 | $6,682 | $310,100 | $58,000 | $252,100 |
| 2020 | $6,682 | $311,400 | $48,000 | $263,400 |
| 2019 | $6,408 | $305,800 | $48,000 | $257,800 |
| 2018 | $6,226 | $305,800 | $48,000 | $257,800 |
| 2017 | $5,904 | $279,600 | $48,000 | $231,600 |
| 2016 | $5,605 | $263,700 | $48,000 | $215,700 |
| 2015 | $5,420 | $264,836 | $48,000 | $216,836 |
| 2014 | $5,450 | $252,859 | $48,000 | $204,859 |
| 2013 | $5,080 | $252,859 | $48,000 | $204,859 |
Source: Public Records
Map
Nearby Homes
- 4301 Viola St NE
- 6312 Casey Ln NE
- 2420 Heritage Green Dr
- 2255 Blairsferry Crossing
- 225 Ridgewood Dr
- 5843 Wells Ln
- 6524 Michael Dr NE
- 5515 W Mustang Rd
- 5854 Wells Ln
- Lot 1A Buffalo Ridge Dr NE
- 6718 Lauder Ln
- 4620 Prairie Stone Dr NE
- 4408 Prairie Stone Dr NE
- 4510 Prairie Stone Dr NE
- 6720 Caldwell Ln
- 5180 Chestnut Valley Rd
- Lot 11 Cross Pointe Blvd NE
- Lot 12 Cross Pointe Blvd NE
- 2596 Anne Ln
- 4620 N River Blvd NE
- 4601 Holly Cir NE
- 4525 Holly Cir NE
- 4715 Holly Cir NE
- 4703 Holly Cir NE
- 4519 Holly Cir NE
- 4721 Holly Cir NE
- 4526 Holly Cir NE
- 4520 Holly Cir NE
- 4513 Holly Cir NE
- 4618 Holly Cir NE
- 4301 Holly Cir NE
- 4612 Holly Cir NE
- 4514 Holly Cir NE
- 4600 Holly Cir NE
- 4606 Holly Cir NE
- 4624 Holly Cir NE
- 4307 Holly Cir NE
- 4507 Holly Cir NE
- 4714 Holly Cir NE
- 4720 Holly Cir NE