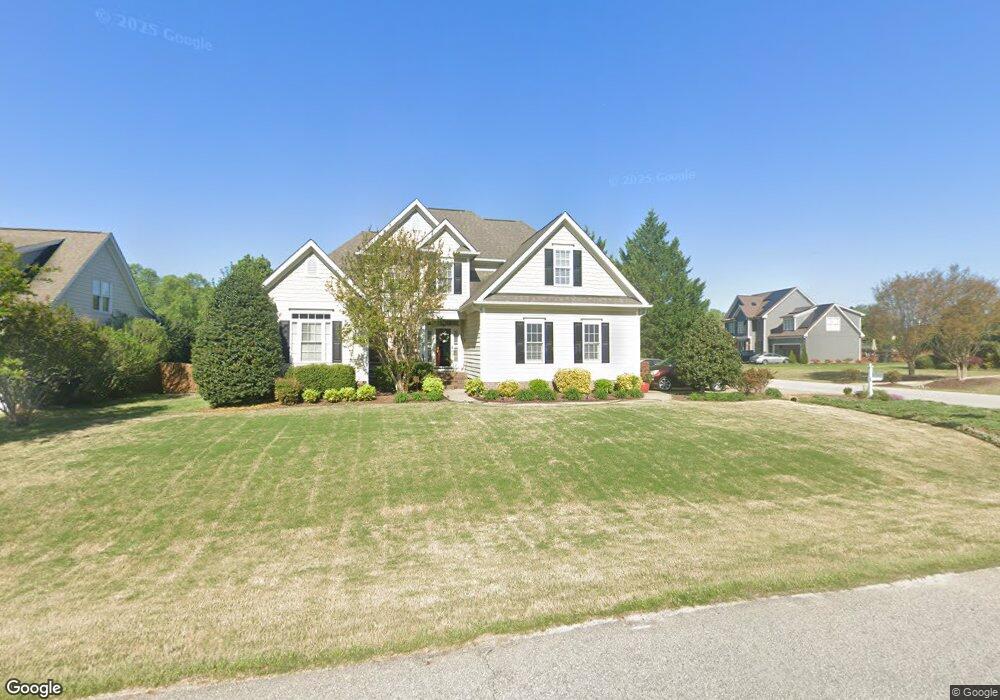
4532 Deer Stream Ln Raleigh, NC 27603
Estimated Value: $544,000 - $588,000
3
Beds
3
Baths
2,691
Sq Ft
$210/Sq Ft
Est. Value
About This Home
This home is located at 4532 Deer Stream Ln, Raleigh, NC 27603 and is currently estimated at $564,456, approximately $209 per square foot. 4532 Deer Stream Ln is a home located in Wake County with nearby schools including Rand Road Elementary, North Garner Middle, and South Garner High.
Ownership History
Date
Name
Owned For
Owner Type
Purchase Details
Closed on
Jan 19, 2019
Sold by
Layne Julie Scott
Bought by
Greenlee John A and Johnston Anna L
Current Estimated Value
Purchase Details
Closed on
Sep 16, 2016
Sold by
Wadsworth Carlton H and Wadsworth Devon A
Bought by
Layne Julie Scott
Home Financials for this Owner
Home Financials are based on the most recent Mortgage that was taken out on this home.
Original Mortgage
$244,000
Interest Rate
3.43%
Mortgage Type
New Conventional
Purchase Details
Closed on
Oct 4, 2012
Sold by
Wadsworth Carlton H and Glick Devon A
Bought by
Wadsworth Carlton H and Glick Devon A
Purchase Details
Closed on
Feb 10, 2012
Sold by
W Chase Homes Inc
Bought by
Wadsworth Carlton H and Glick Devon A
Home Financials for this Owner
Home Financials are based on the most recent Mortgage that was taken out on this home.
Original Mortgage
$247,000
Interest Rate
3.99%
Mortgage Type
New Conventional
Create a Home Valuation Report for This Property
The Home Valuation Report is an in-depth analysis detailing your home's value as well as a comparison with similar homes in the area
Home Values in the Area
Average Home Value in this Area
Purchase History
| Date | Buyer | Sale Price | Title Company |
|---|---|---|---|
| Greenlee John A | $325,500 | None Available | |
| Layne Julie Scott | $310,000 | None Available | |
| Wadsworth Carlton H | -- | None Available | |
| Wadsworth Carlton H | $260,000 | None Available |
Source: Public Records
Mortgage History
| Date | Status | Borrower | Loan Amount |
|---|---|---|---|
| Previous Owner | Layne Julie Scott | $244,000 | |
| Previous Owner | Wadsworth Carlton H | $247,000 |
Source: Public Records
Tax History Compared to Growth
Tax History
| Year | Tax Paid | Tax Assessment Tax Assessment Total Assessment is a certain percentage of the fair market value that is determined by local assessors to be the total taxable value of land and additions on the property. | Land | Improvement |
|---|---|---|---|---|
| 2025 | $3,232 | $502,216 | $95,000 | $407,216 |
| 2024 | $3,139 | $502,216 | $95,000 | $407,216 |
| 2023 | $2,672 | $340,125 | $48,000 | $292,125 |
| 2022 | $2,476 | $340,125 | $48,000 | $292,125 |
| 2021 | $2,410 | $340,125 | $48,000 | $292,125 |
| 2020 | $2,370 | $340,125 | $48,000 | $292,125 |
| 2019 | $2,548 | $309,506 | $60,000 | $249,506 |
| 2018 | $2,343 | $309,506 | $60,000 | $249,506 |
| 2017 | $2,221 | $309,506 | $60,000 | $249,506 |
| 2016 | $2,176 | $309,506 | $60,000 | $249,506 |
| 2015 | $2,349 | $335,418 | $44,000 | $291,418 |
| 2014 | -- | $335,418 | $44,000 | $291,418 |
Source: Public Records
Map
Nearby Homes
- 5013 Contender Dr
- 449 Kings Hollow Dr
- 4117 Bashford Bluffs Ln
- 1009 Feldmen Dr
- 10001 Joe Leach Rd
- 1101 Robinfield Dr
- 2600 Banks Rd Unit Lot 2
- 2600 Banks Rd Unit Lot 1
- The Crawford Plan at Laneridge Estates
- The Crawford C Plan at Laneridge Estates
- The Beech Plan at Laneridge Estates
- 5000 Trotter Dr
- 1121 Whitecroft Dr
- 701 Rand Rd
- 261 Inkster Cove
- 100 Chalcedony St
- 5040 Trotter Dr
- 8529 Hurst Dr
- 2704 Stageline Dr
- 321 Seastone St
- 4532 Deer Stream Ln Unit Lot16
- 4752 Swordfish Dr
- 4752 Swordfish Dr Unit Lt 17
- 4749 Swordfish Dr
- 4753 Swordfish Dr
- 4756 Swordfish Dr
- 4744 Swordfish Dr
- 4757 Swordfish Dr
- 4745 Swordfish Dr
- 4523 Deer Stream Ln
- 4528 Deer Stream Ln
- 4760 Swordfish Dr
- 4761 Swordfish Dr
- 4740 Swordfish Dr
- 4740 Swordfish Dr Unit Lot13
- 4741 Swordfish Dr
- 4519 Deer Stream Ln
- 4764 Swordfish Dr
- 4524 Deer Stream Ln
- 4736 Swordfish Dr