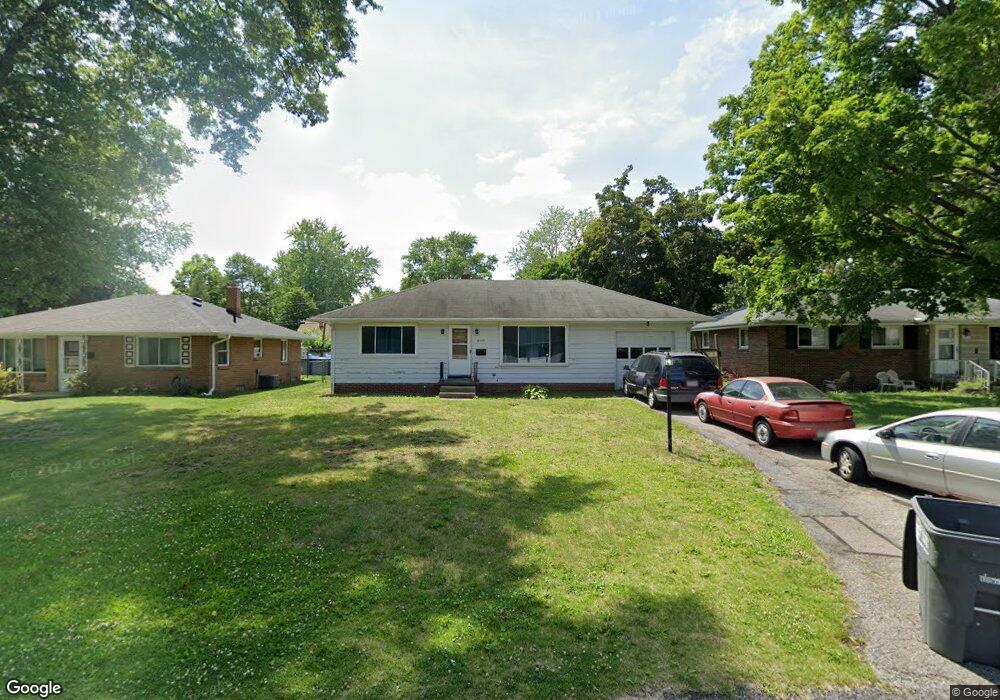
4533 Harbord Dr Toledo, OH 43623
Franklin Park NeighborhoodEstimated Value: $143,000 - $177,000
2
Beds
2
Baths
1,008
Sq Ft
$164/Sq Ft
Est. Value
About This Home
This home is located at 4533 Harbord Dr, Toledo, OH 43623 and is currently estimated at $165,259, approximately $163 per square foot. 4533 Harbord Dr is a home located in Lucas County with nearby schools including Monac Elementary School, Jefferson Junior High School, and Washington Junior High School.
Ownership History
Date
Name
Owned For
Owner Type
Purchase Details
Closed on
Nov 14, 2007
Sold by
Fannie Mae
Bought by
Cox Timothy W
Current Estimated Value
Home Financials for this Owner
Home Financials are based on the most recent Mortgage that was taken out on this home.
Original Mortgage
$72,100
Outstanding Balance
$45,830
Interest Rate
6.47%
Mortgage Type
Purchase Money Mortgage
Estimated Equity
$119,429
Purchase Details
Closed on
Apr 2, 2007
Sold by
Perna Danette M and Select Portfolio Servicing Inc
Bought by
Federal National Mortgage Association
Purchase Details
Closed on
Aug 2, 2001
Sold by
Doherty Douglas F
Bought by
Perna Danette M
Home Financials for this Owner
Home Financials are based on the most recent Mortgage that was taken out on this home.
Original Mortgage
$63,000
Interest Rate
10.05%
Create a Home Valuation Report for This Property
The Home Valuation Report is an in-depth analysis detailing your home's value as well as a comparison with similar homes in the area
Home Values in the Area
Average Home Value in this Area
Purchase History
| Date | Buyer | Sale Price | Title Company |
|---|---|---|---|
| Cox Timothy W | $72,100 | Louisville Title Agency For | |
| Federal National Mortgage Association | $73,334 | None Available | |
| Perna Danette M | $90,000 | Louisville Title Agency For |
Source: Public Records
Mortgage History
| Date | Status | Borrower | Loan Amount |
|---|---|---|---|
| Open | Cox Timothy W | $72,100 | |
| Previous Owner | Perna Danette M | $63,000 |
Source: Public Records
Tax History Compared to Growth
Tax History
| Year | Tax Paid | Tax Assessment Tax Assessment Total Assessment is a certain percentage of the fair market value that is determined by local assessors to be the total taxable value of land and additions on the property. | Land | Improvement |
|---|---|---|---|---|
| 2024 | $1,204 | $38,465 | $7,805 | $30,660 |
| 2023 | $2,490 | $34,195 | $6,930 | $27,265 |
| 2022 | $2,469 | $34,195 | $6,930 | $27,265 |
| 2021 | $2,538 | $34,195 | $6,930 | $27,265 |
| 2020 | $2,437 | $28,070 | $5,705 | $22,365 |
| 2019 | $2,358 | $28,070 | $5,705 | $22,365 |
| 2018 | $2,164 | $28,070 | $5,705 | $22,365 |
| 2017 | $1,995 | $24,465 | $5,355 | $19,110 |
| 2016 | $2,003 | $69,900 | $15,300 | $54,600 |
| 2015 | $2,026 | $69,900 | $15,300 | $54,600 |
| 2014 | $1,667 | $24,470 | $5,360 | $19,110 |
| 2013 | $1,667 | $24,470 | $5,360 | $19,110 |
Source: Public Records
Map
Nearby Homes
- 4436 Foxglove Rd
- 4639 Boydson Dr
- 4641 Naomi Dr
- 3605 W Laskey Rd
- 3510 W Laskey Rd
- 4744 Kathy Ln
- 3513 Cedardale Ct
- 3751 Philmar Dr
- 5131 Oakridge Dr
- 3755 Baybrook Ln
- 5044 Secor Rd
- 4840 Elm Place
- 3036 Wyndale Rd
- 5104 Tillimon Trail
- 4024 Crary Dr
- 4823 Cedarhurst Rd
- 5208 Oakridge Dr
- 5240 Rambo Ln
- 5215 Secor Rd
- 3560 Helene Ct
- 4527 Harbord Dr
- 4539 Harbord Dr
- 4521 Harbord Dr
- 4545 Harbord Dr
- 4538 Hannaford Dr
- 4542 Hannaford Dr
- 4526 Hannaford Dr
- 4515 Harbord Dr
- 4601 Harbord Dr
- 4548 Hannaford Dr
- 4522 Hannaford Dr
- 4534 Harbord Dr
- 4528 Harbord Dr
- 4540 Harbord Dr
- 4604 Hannaford Dr
- 4522 Harbord Dr
- 4546 Harbord Dr
- 4518 Hannaford Dr
- 4605 Harbord Dr
- 4509 Harbord Dr