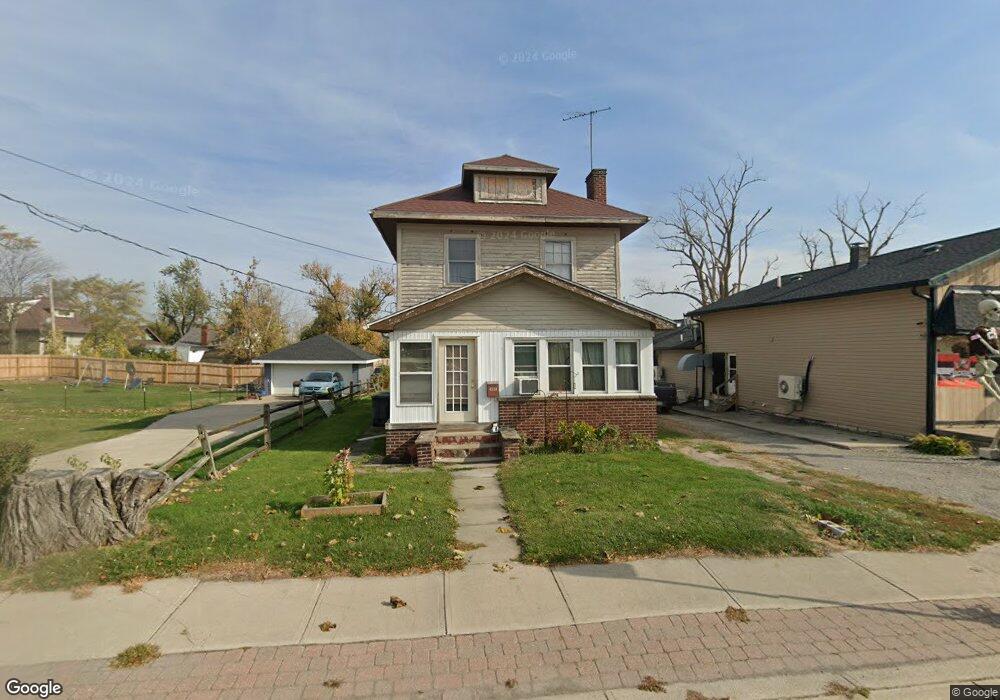
4534 N Summit St Toledo, OH 43611
Point Place NeighborhoodEstimated Value: $97,000 - $178,000
4
Beds
1
Bath
1,545
Sq Ft
$96/Sq Ft
Est. Value
About This Home
This home is located at 4534 N Summit St, Toledo, OH 43611 and is currently estimated at $149,038, approximately $96 per square foot. 4534 N Summit St is a home located in Lucas County with nearby schools including Ottawa River Elementary School, Woodward High School, and Imagine Environmental Science Academy.
Ownership History
Date
Name
Owned For
Owner Type
Purchase Details
Closed on
Apr 22, 2005
Sold by
Federal Home Loan Mortgage Corporation
Bought by
Smith Shane
Current Estimated Value
Home Financials for this Owner
Home Financials are based on the most recent Mortgage that was taken out on this home.
Original Mortgage
$47,920
Interest Rate
5.82%
Mortgage Type
Fannie Mae Freddie Mac
Purchase Details
Closed on
Nov 5, 2004
Sold by
Quiroz Frank Marcus and Quiroz Mimi Marie
Bought by
Federal Home Loan Mortgage Corporation
Purchase Details
Closed on
May 14, 2002
Sold by
Dotson Jane M
Bought by
Quiroz Frank Marcus and Quiroz Mimi Marie
Home Financials for this Owner
Home Financials are based on the most recent Mortgage that was taken out on this home.
Original Mortgage
$71,250
Interest Rate
7.16%
Create a Home Valuation Report for This Property
The Home Valuation Report is an in-depth analysis detailing your home's value as well as a comparison with similar homes in the area
Home Values in the Area
Average Home Value in this Area
Purchase History
| Date | Buyer | Sale Price | Title Company |
|---|---|---|---|
| Smith Shane | -- | -- | |
| Federal Home Loan Mortgage Corporation | $52,000 | -- | |
| Quiroz Frank Marcus | $75,000 | -- |
Source: Public Records
Mortgage History
| Date | Status | Borrower | Loan Amount |
|---|---|---|---|
| Previous Owner | Smith Shane | $47,920 | |
| Previous Owner | Quiroz Frank Marcus | $71,250 |
Source: Public Records
Tax History Compared to Growth
Tax History
| Year | Tax Paid | Tax Assessment Tax Assessment Total Assessment is a certain percentage of the fair market value that is determined by local assessors to be the total taxable value of land and additions on the property. | Land | Improvement |
|---|---|---|---|---|
| 2024 | $810 | $35,700 | $5,565 | $30,135 |
| 2023 | $1,250 | $27,895 | $4,900 | $22,995 |
| 2022 | $1,275 | $27,895 | $4,900 | $22,995 |
| 2021 | $1,301 | $27,895 | $4,900 | $22,995 |
| 2020 | $1,731 | $23,100 | $4,060 | $19,040 |
| 2019 | $1,682 | $23,100 | $4,060 | $19,040 |
| 2018 | $1,649 | $23,100 | $4,060 | $19,040 |
| 2017 | $1,623 | $21,035 | $4,165 | $16,870 |
| 2016 | $1,623 | $60,100 | $11,900 | $48,200 |
| 2015 | $1,609 | $60,100 | $11,900 | $48,200 |
| 2014 | $1,323 | $21,040 | $4,170 | $16,870 |
| 2013 | $1,323 | $21,040 | $4,170 | $16,870 |
Source: Public Records
Map
Nearby Homes
- 4532 N Summit St
- 4540 N Summit St
- 4544 N Summit St
- 2812 103rd St
- 2816 103rd St
- 2820 103rd St
- 2824 103rd St
- 4541 N Summit St
- 2832 103rd St
- 4525 N Summit St
- 2736 102nd St
- 2809 103rd St
- 2817 103rd St
- 4515 N Summit St
- 2821 103rd St
- 2801 103rd St
- 2740 102nd St
- 2823 103rd St
- 2753 102nd St
- 4565 N Summit St