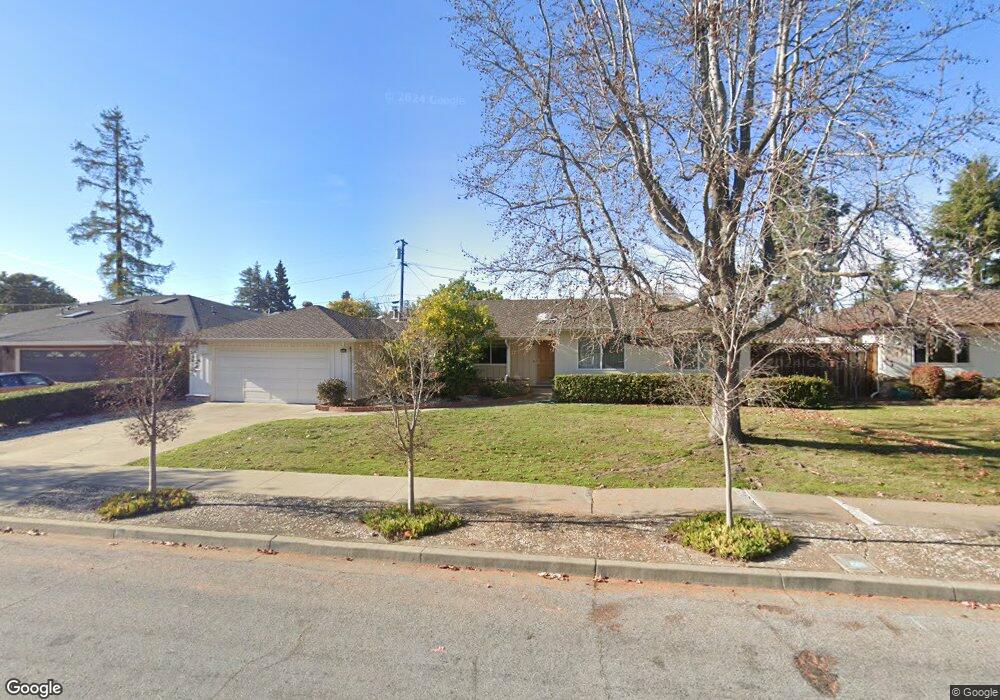
4535 Logan Ct Fremont, CA 94536
Glenmoor NeighborhoodEstimated Value: $1,802,000 - $2,117,000
4
Beds
3
Baths
2,308
Sq Ft
$832/Sq Ft
Est. Value
About This Home
This home is located at 4535 Logan Ct, Fremont, CA 94536 and is currently estimated at $1,920,768, approximately $832 per square foot. 4535 Logan Ct is a home located in Alameda County with nearby schools including Glenmoor Elementary School, Centerville Junior High School, and Washington High School.
Ownership History
Date
Name
Owned For
Owner Type
Purchase Details
Closed on
Oct 28, 2014
Sold by
Chew Harold S and Chew Alice L
Bought by
Harold Hew & Alice Chew Family Trust
Current Estimated Value
Purchase Details
Closed on
Aug 22, 2005
Sold by
Chew Harold S and Chew Alice L
Bought by
Chew Harold S and Chew Alice L
Purchase Details
Closed on
Aug 5, 1996
Sold by
Chew Roland G and Jue Bonnie L
Bought by
Chew Harold S and Chew Alice L
Create a Home Valuation Report for This Property
The Home Valuation Report is an in-depth analysis detailing your home's value as well as a comparison with similar homes in the area
Home Values in the Area
Average Home Value in this Area
Purchase History
| Date | Buyer | Sale Price | Title Company |
|---|---|---|---|
| Harold Hew & Alice Chew Family Trust | -- | None Available | |
| Chew Harold S | -- | -- | |
| Chew Harold S | -- | -- |
Source: Public Records
Tax History Compared to Growth
Tax History
| Year | Tax Paid | Tax Assessment Tax Assessment Total Assessment is a certain percentage of the fair market value that is determined by local assessors to be the total taxable value of land and additions on the property. | Land | Improvement |
|---|---|---|---|---|
| 2025 | $2,258 | $129,444 | $29,691 | $106,753 |
| 2024 | $2,258 | $126,769 | $29,109 | $104,660 |
| 2023 | $2,177 | $131,146 | $28,538 | $102,608 |
| 2022 | $2,121 | $121,574 | $27,978 | $100,596 |
| 2021 | $2,075 | $119,054 | $27,430 | $98,624 |
| 2020 | $1,991 | $124,762 | $27,149 | $97,613 |
| 2019 | $1,972 | $122,315 | $26,616 | $95,699 |
| 2018 | $1,929 | $119,917 | $26,094 | $93,823 |
| 2017 | $1,880 | $117,566 | $25,583 | $91,983 |
| 2016 | $1,833 | $115,261 | $25,081 | $90,180 |
| 2015 | $1,795 | $113,530 | $24,705 | $88,825 |
| 2014 | $1,753 | $111,306 | $24,221 | $87,085 |
Source: Public Records
Map
Nearby Homes
- 4586 Norris Rd
- 37621 Glenmoor Dr
- 37721 Madera Ct
- 4737 Deadwood Dr
- 4715 Eggers Dr
- 38265 Corrigan Ct
- 4328 Cognina Ct
- 38324 Blacow Rd
- 37987 Alta Dr
- 4754 Northdale Dr
- 4637 Rothbury Common
- Plan 1629 at Veranda
- Plan 1165 at Veranda
- Plan 1670 at Veranda
- Plan 1455 at Veranda
- Plan 1394 at Veranda
- Plan 1725 at Veranda
- Plan 1378 at Veranda
- Plan 1657 at Veranda
- 37792 Colfax Ct
- 4551 Logan Ct
- 4519 Logan Ct
- 4548 Faulkner Ct
- 4532 Faulkner Ct
- 37831 Logan Dr
- 4536 Logan Ct
- 37815 Logan Dr
- 4564 Faulkner Ct
- 4520 Logan Ct
- 4550 Logan Ct
- 4565 Logan Ct
- 37925 Logan Dr
- 4516 Faulkner Ct
- 4580 Logan Ct
- 4566 Logan Ct
- 4580 Faulkner Ct
- 4525 Norris Rd
- 4515 Norris Rd
- 4537 Norris Rd
- 37830 Logan Dr