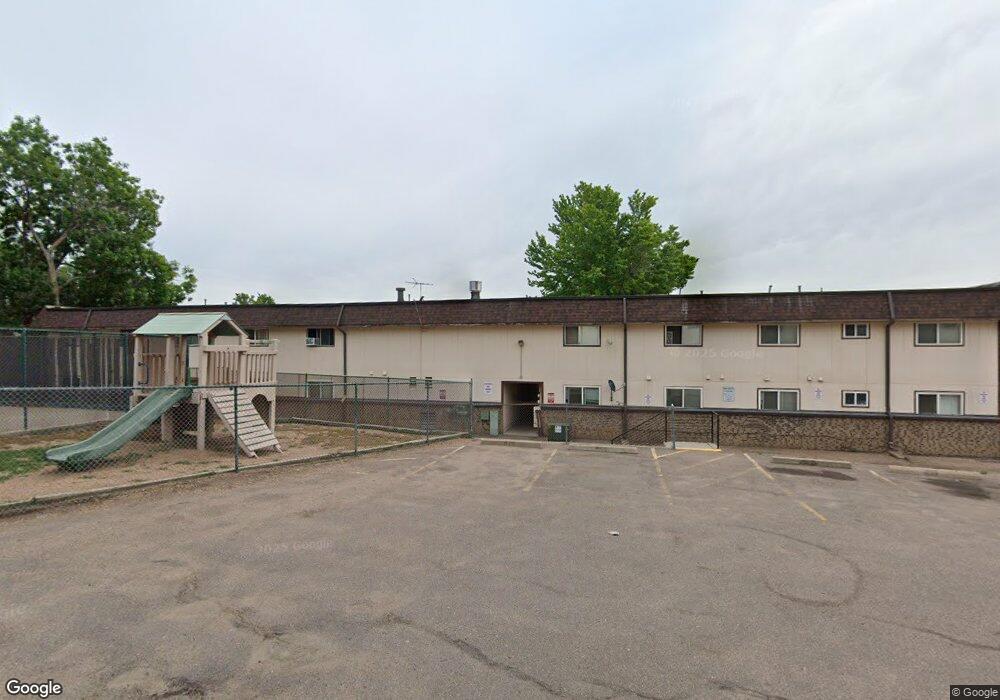
4535 S Lowell Blvd Unit 23 Denver, CO 80236
Fort Logan NeighborhoodEstimated Value: $167,000 - $211,000
1
Bed
1
Bath
673
Sq Ft
$287/Sq Ft
Est. Value
About This Home
This home is located at 4535 S Lowell Blvd Unit 23, Denver, CO 80236 and is currently estimated at $192,932, approximately $286 per square foot. 4535 S Lowell Blvd Unit 23 is a home located in Denver County with nearby schools including Kaiser Elementary School, Bear Valley International School, and John F Kennedy High School.
Ownership History
Date
Name
Owned For
Owner Type
Purchase Details
Closed on
Oct 18, 2022
Sold by
Union Fidelity Llc
Bought by
Sparks Daniel Lee
Current Estimated Value
Home Financials for this Owner
Home Financials are based on the most recent Mortgage that was taken out on this home.
Original Mortgage
$180,000
Outstanding Balance
$173,031
Interest Rate
5.89%
Mortgage Type
Balloon
Estimated Equity
$19,901
Purchase Details
Closed on
Apr 11, 2014
Sold by
Wells Fargo Bank Na
Bought by
Union Fidelity Llc
Purchase Details
Closed on
Jan 2, 2014
Sold by
Mckamey David
Bought by
Wells Fargo Bank Na
Purchase Details
Closed on
Jul 26, 2006
Sold by
Aupperle Marie and Estate Of Leslie Alison Buckla
Bought by
Mckamey David
Home Financials for this Owner
Home Financials are based on the most recent Mortgage that was taken out on this home.
Original Mortgage
$55,775
Interest Rate
6.66%
Mortgage Type
Purchase Money Mortgage
Create a Home Valuation Report for This Property
The Home Valuation Report is an in-depth analysis detailing your home's value as well as a comparison with similar homes in the area
Home Values in the Area
Average Home Value in this Area
Purchase History
| Date | Buyer | Sale Price | Title Company |
|---|---|---|---|
| Sparks Daniel Lee | $200,000 | Land Title | |
| Union Fidelity Llc | $47,615 | Servicelink | |
| Wells Fargo Bank Na | -- | None Available | |
| Mckamey David | $57,500 | Fahtco |
Source: Public Records
Mortgage History
| Date | Status | Borrower | Loan Amount |
|---|---|---|---|
| Open | Sparks Daniel Lee | $180,000 | |
| Previous Owner | Mckamey David | $55,775 | |
| Closed | Sparks Daniel Lee | $25,000 |
Source: Public Records
Tax History Compared to Growth
Tax History
| Year | Tax Paid | Tax Assessment Tax Assessment Total Assessment is a certain percentage of the fair market value that is determined by local assessors to be the total taxable value of land and additions on the property. | Land | Improvement |
|---|---|---|---|---|
| 2024 | $724 | $9,140 | $800 | $8,340 |
| 2023 | $708 | $9,140 | $800 | $8,340 |
| 2022 | $831 | $10,450 | $830 | $9,620 |
| 2021 | $831 | $10,750 | $850 | $9,900 |
| 2020 | $589 | $7,940 | $850 | $7,090 |
| 2019 | $573 | $7,940 | $850 | $7,090 |
| 2018 | $418 | $5,400 | $790 | $4,610 |
| 2017 | $417 | $5,400 | $790 | $4,610 |
| 2016 | $315 | $3,860 | $868 | $2,992 |
| 2015 | $302 | $3,860 | $868 | $2,992 |
| 2014 | $237 | $2,850 | $557 | $2,293 |
Source: Public Records
Map
Nearby Homes
- 4569 S Lowell Blvd Unit B
- 4445 S Lowell Blvd
- 3831 W Rutgers Place
- 4639 S Lowell Blvd Unit B
- 4641 S Lowell Blvd Unit D
- 4643 S Lowell Blvd Unit B
- 4621 S Lowell Blvd Unit J6
- 3659 W Union Ave Unit F4
- 3713 W Union Ave
- 3590 W Pimlico Ave
- 3395 W Union Ave
- 3379 W Wagon Trail Dr
- 4095 W Radcliff Ave
- 3288 W Tufts Ave
- 4155 W Stanford Ave
- 4090 W Wagon Trail Dr
- 4749 S Irving St
- 4201 W Tufts Ave
- 4415 S Tennyson St
- 4244 W Monmouth Ave
- 4599 S Lowell Blvd Unit D
- 4599 S Lowell Blvd Unit C
- 4599 S Lowell Blvd Unit A
- 4599 S Lowell Blvd Unit B
- 4599 S Lowell Blvd
- 4567 S Lowell Blvd
- 4567 S Lowell Blvd Unit 15
- 4567 S Lowell Blvd
- 4567 S Lowell Blvd
- 4541 S Lowell Blvd Unit 30
- 4541 S Lowell Blvd Unit 29
- 4537 S Lowell Blvd Unit 26
- 4537 S Lowell Blvd
- 4537 S Lowell Blvd
- 4533 S Lowell Blvd Unit 22
- 4533 S Lowell Blvd Unit 21
- 4533 S Lowell Blvd
- 4531 S Lowell Blvd
- 4531 S Lowell Blvd
- 4541 S Lowell Blvd Unit 15