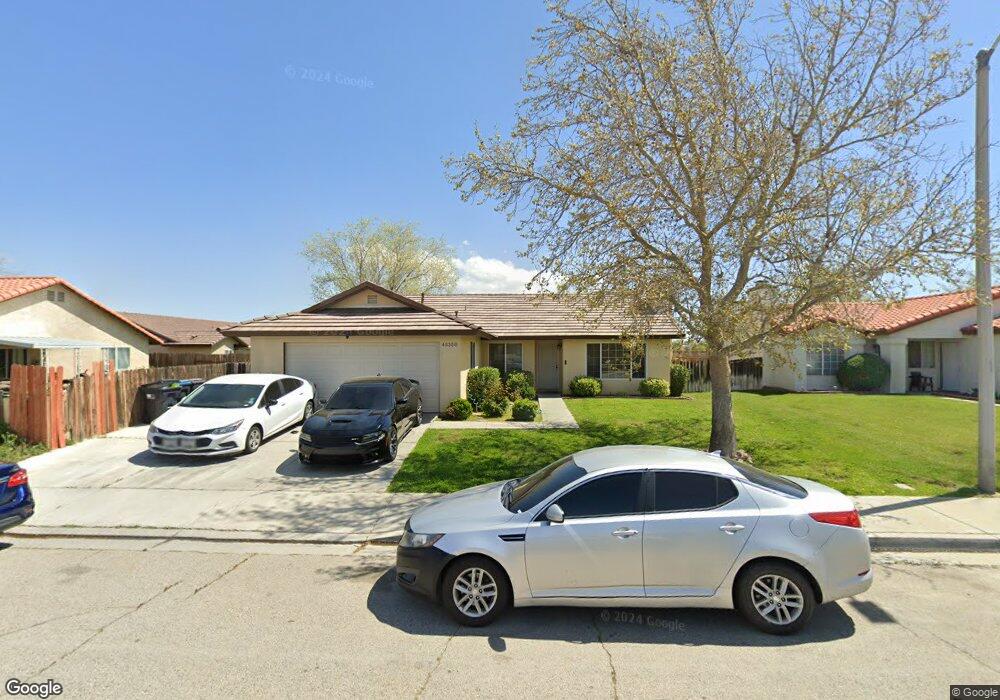
45350 18th St E Lancaster, CA 93535
East Lancaster NeighborhoodEstimated Value: $402,364 - $420,000
3
Beds
2
Baths
1,385
Sq Ft
$298/Sq Ft
Est. Value
About This Home
This home is located at 45350 18th St E, Lancaster, CA 93535 and is currently estimated at $412,341, approximately $297 per square foot. 45350 18th St E is a home located in Los Angeles County with nearby schools including Discovery Elementary School, Piute Middle School, and Antelope Valley High School.
Ownership History
Date
Name
Owned For
Owner Type
Purchase Details
Closed on
Dec 15, 2025
Sold by
Big Bro Llc
Bought by
Big Brother Llc
Current Estimated Value
Purchase Details
Closed on
Jan 21, 2025
Sold by
Fred And Teresa Zullo Trust and Zullo Fred A
Bought by
Big Bro Llc
Purchase Details
Closed on
Aug 7, 2018
Sold by
Zullo Fred A and Zullo Fred A
Bought by
Zullo Fred A and Zullo Teresa P
Purchase Details
Closed on
Dec 3, 2009
Sold by
Zullo Teresa P
Bought by
Zullo Fred A
Purchase Details
Closed on
Aug 20, 2009
Sold by
Dinsmore Erin M
Bought by
Federal Home Loan Mortgage Corporation
Purchase Details
Closed on
Sep 23, 1998
Sold by
Va
Bought by
Dinsmore Erin M
Home Financials for this Owner
Home Financials are based on the most recent Mortgage that was taken out on this home.
Original Mortgage
$73,100
Interest Rate
6.88%
Mortgage Type
Seller Take Back
Purchase Details
Closed on
Oct 20, 1997
Sold by
Norwest Mtg Inc
Bought by
Va
Purchase Details
Closed on
Oct 17, 1997
Sold by
Emrick Donald E
Bought by
Norwest Mtg Inc
Create a Home Valuation Report for This Property
The Home Valuation Report is an in-depth analysis detailing your home's value as well as a comparison with similar homes in the area
Home Values in the Area
Average Home Value in this Area
Purchase History
| Date | Buyer | Sale Price | Title Company |
|---|---|---|---|
| Big Brother Llc | -- | Accommodation/Courtesy Recordi | |
| Big Bro Llc | -- | -- | |
| Zullo Fred A | -- | None Available | |
| Zullo Fred A | -- | Orange Coast Title | |
| Zullo Fred A | $95,000 | Orange Coast Title | |
| Federal Home Loan Mortgage Corporation | $91,994 | Accommodation | |
| Dinsmore Erin M | $73,500 | First American Title Co | |
| Va | -- | Benefit Land Title Ins Co | |
| Norwest Mtg Inc | $62,251 | Benefit Land Title Ins Co |
Source: Public Records
Mortgage History
| Date | Status | Borrower | Loan Amount |
|---|---|---|---|
| Previous Owner | Dinsmore Erin M | $73,100 |
Source: Public Records
Tax History
| Year | Tax Paid | Tax Assessment Tax Assessment Total Assessment is a certain percentage of the fair market value that is determined by local assessors to be the total taxable value of land and additions on the property. | Land | Improvement |
|---|---|---|---|---|
| 2025 | $2,955 | $122,613 | $24,519 | $98,094 |
| 2024 | $2,955 | $120,210 | $24,039 | $96,171 |
| 2023 | $2,899 | $117,854 | $23,568 | $94,286 |
| 2022 | $2,720 | $115,544 | $23,106 | $92,438 |
| 2021 | $2,342 | $113,279 | $22,653 | $90,626 |
| 2020 | $2,320 | $112,118 | $22,421 | $89,697 |
| 2019 | $2,287 | $109,921 | $21,982 | $87,939 |
| 2018 | $2,250 | $107,766 | $21,551 | $86,215 |
| 2016 | $2,146 | $103,583 | $20,715 | $82,868 |
| 2015 | $2,124 | $102,028 | $20,404 | $81,624 |
| 2014 | $2,129 | $100,031 | $20,005 | $80,026 |
Source: Public Records
Map
Nearby Homes
- N. Ave. I N 20th St E Vic Ave I
- 0 20th St E Unit HD25028073
- 0 20th St E Unit HD26025654
- 80 E Avenue I
- 0 127 ST E Avenue I
- 230 E Avenue I
- 2059 E Avenue I
- 2059 E Avenue I Unit Spc 47
- 1832 E Ivesbrook St
- 2013 E Ivesbrook St
- 45133 17th St E
- 45064 18th St E
- 2121 E I Unit 10
- 45628 Rachel Ave
- 2121 E Avenue I Unit 28
- 2121 E Avenue I Unit SPC 81
- 1501 E Avenue I Unit Spc 148
- 1501 E Avenue I Unit 115
- 1537 E Holguin St
- 2125 E Jackman St
- 45344 18th St E
- 1804 E Avenue h12
- 1800 E Avenue h12
- 45338 18th St E
- 45332 18th St E
- 1736 E Avenue h12
- 45351 18th St E
- 45345 18th St E
- 45405 18th St E
- 45326 18th St E
- 1730 E Avenue h12
- 45333 18th St E
- 1741 E Avenue h12
- 45411 18th St E
- 45320 18th St E
- 45327 18th St E
- 1735 E Avenue h12
- 1729 E Avenue h12
- 45321 18th St E
- 45417 18th St E
Your Personal Tour Guide
Ask me questions while you tour the home.