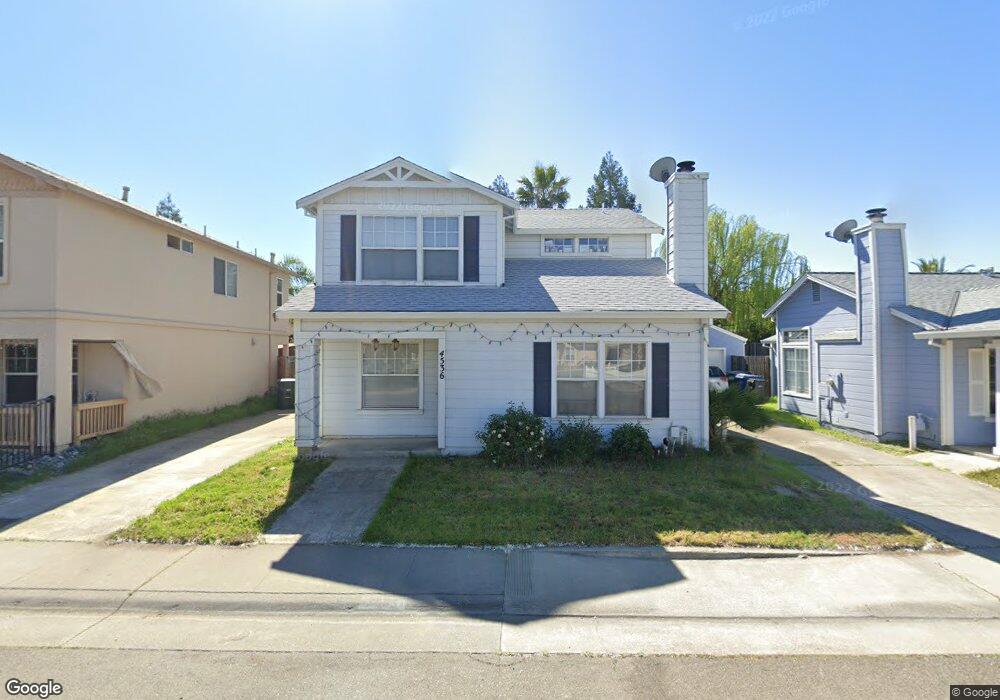
4536 Courtyard Way Antelope, CA 95843
Estimated Value: $402,000 - $497,000
4
Beds
3
Baths
1,543
Sq Ft
$306/Sq Ft
Est. Value
About This Home
This home is located at 4536 Courtyard Way, Antelope, CA 95843 and is currently estimated at $472,204, approximately $306 per square foot. 4536 Courtyard Way is a home located in Sacramento County with nearby schools including Barrett Ranch Elementary School, Antelope Crossing Middle School, and Antelope High School.
Ownership History
Date
Name
Owned For
Owner Type
Purchase Details
Closed on
Jul 11, 2005
Sold by
Huddleston Ronald G
Bought by
Johnson Randolph M and Beasley Keinya S
Current Estimated Value
Home Financials for this Owner
Home Financials are based on the most recent Mortgage that was taken out on this home.
Original Mortgage
$268,000
Outstanding Balance
$157,783
Interest Rate
7.7%
Mortgage Type
Purchase Money Mortgage
Estimated Equity
$314,421
Purchase Details
Closed on
Nov 21, 2003
Sold by
Garman Paul Clinton and Garman Angela L
Bought by
Huddleston Ronald G
Home Financials for this Owner
Home Financials are based on the most recent Mortgage that was taken out on this home.
Original Mortgage
$254,000
Interest Rate
6.49%
Mortgage Type
Purchase Money Mortgage
Purchase Details
Closed on
May 17, 2002
Sold by
Garman Landis C and Garman Reiko H
Bought by
Garman Paul Clinton and Garman Angela L
Create a Home Valuation Report for This Property
The Home Valuation Report is an in-depth analysis detailing your home's value as well as a comparison with similar homes in the area
Home Values in the Area
Average Home Value in this Area
Purchase History
| Date | Buyer | Sale Price | Title Company |
|---|---|---|---|
| Johnson Randolph M | $335,000 | Financial Title Company | |
| Huddleston Ronald G | $254,000 | New Century Title Company | |
| Garman Paul Clinton | -- | -- |
Source: Public Records
Mortgage History
| Date | Status | Borrower | Loan Amount |
|---|---|---|---|
| Open | Johnson Randolph M | $268,000 | |
| Previous Owner | Huddleston Ronald G | $254,000 |
Source: Public Records
Tax History Compared to Growth
Tax History
| Year | Tax Paid | Tax Assessment Tax Assessment Total Assessment is a certain percentage of the fair market value that is determined by local assessors to be the total taxable value of land and additions on the property. | Land | Improvement |
|---|---|---|---|---|
| 2025 | $8,702 | $457,783 | $136,646 | $321,137 |
| 2024 | $8,702 | $448,808 | $133,967 | $314,841 |
| 2023 | $8,551 | $440,009 | $131,341 | $308,668 |
| 2022 | $8,473 | $431,382 | $128,766 | $302,616 |
| 2021 | $5,887 | $385,280 | $115,006 | $270,274 |
| 2020 | $5,357 | $339,454 | $101,327 | $238,127 |
| 2019 | $5,160 | $320,241 | $95,592 | $224,649 |
| 2018 | $4,847 | $299,292 | $89,339 | $209,953 |
| 2017 | $4,514 | $269,633 | $80,486 | $189,147 |
| 2016 | $4,076 | $236,521 | $70,602 | $165,919 |
| 2015 | $3,779 | $215,020 | $64,184 | $150,836 |
| 2014 | $4,182 | $199,093 | $59,430 | $139,663 |
Source: Public Records
Map
Nearby Homes
- 7761 Megan Ann Way
- 7805 Megan Ann Ct
- 7813 Megan Ann Ct
- 7929 Eagle Peak Way
- 7926 Eagle Peak Way
- 7949 Ivy Hill Way
- 8020 Walerga Rd Unit 1061
- 8020 Walerga Rd Unit 1024
- 8020 Walerga Rd Unit 3
- 8011 Eagle Peak Way
- 8038 Falcon View Dr
- 8210 Rambleton Way
- 7600 Antelope Hills Dr
- 4229 Shandwick Dr
- 8121 Deer Spring Cir
- 4253 Hartlepool Way
- 7531 Event Way
- 7535 Event Way
- 4319 Hartlepool Way
- 3937 Running Bear Way
- 4532 Courtyard Way
- 4540 Stonebriar Ct
- 4528 Courtyard Way
- 4544 Stonebriar Ct
- 4524 Winje Dr
- 4528 Winje Dr
- 7834 Regency Woods Way
- 4520 Winje Dr
- 7833 Regency Woods Way
- 4532 Winje Dr
- 4524 Courtyard Way
- 4548 Stonebriar Ct
- 4516 Winje Dr
- 7837 Regency Woods Way
- 4547 Stonebriar Ct
- 4536 Winje Dr
- 7840 Regency Woods Way
- 7834 Crestleigh Ct
- 4520 Courtyard Way
- 4552 Stonebriar Ct