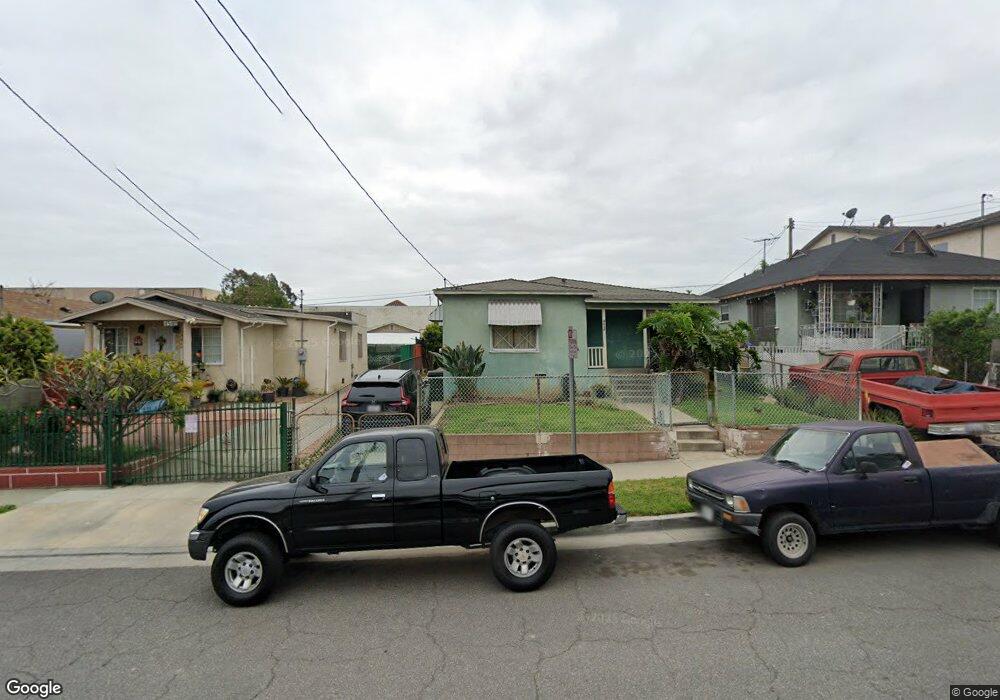
4536 E 2nd St Los Angeles, CA 90022
Estimated Value: $578,000 - $730,000
4
Beds
2
Baths
1,483
Sq Ft
$449/Sq Ft
Est. Value
About This Home
This home is located at 4536 E 2nd St, Los Angeles, CA 90022 and is currently estimated at $665,298, approximately $448 per square foot. 4536 E 2nd St is a home located in Los Angeles County with nearby schools including Brooklyn Avenue Elementary School, East Los Angeles Renaissance Academy, and Humanitas Academy Of Art And Technology At Esteban E. Torres High No. 4.
Create a Home Valuation Report for This Property
The Home Valuation Report is an in-depth analysis detailing your home's value as well as a comparison with similar homes in the area
Home Values in the Area
Average Home Value in this Area
Tax History
| Year | Tax Paid | Tax Assessment Tax Assessment Total Assessment is a certain percentage of the fair market value that is determined by local assessors to be the total taxable value of land and additions on the property. | Land | Improvement |
|---|---|---|---|---|
| 2025 | $1,634 | $39,392 | $17,610 | $21,782 |
| 2024 | $1,634 | $38,620 | $17,265 | $21,355 |
| 2023 | $1,447 | $37,864 | $16,927 | $20,937 |
| 2022 | $1,413 | $37,123 | $16,596 | $20,527 |
| 2021 | $1,389 | $36,396 | $16,271 | $20,125 |
| 2020 | $1,387 | $36,024 | $16,105 | $19,919 |
| 2019 | $1,364 | $35,319 | $15,790 | $19,529 |
| 2018 | $1,303 | $34,628 | $15,481 | $19,147 |
| 2016 | $1,245 | $33,285 | $14,881 | $18,404 |
| 2015 | $1,232 | $32,786 | $14,658 | $18,128 |
| 2014 | $1,239 | $32,144 | $14,371 | $17,773 |
Source: Public Records
Map
Nearby Homes
- 4612 E 2nd St
- 4636 E 2nd St
- 225 S Kern Ave
- 223 S Kern Ave
- 339 N Mcdonnell Ave
- 4241 Eugene St
- 459 S Sydney Dr
- 4149 Zaring St
- 4521 Dozier Ave
- 4616 Hammel St
- 4748 Dozier St
- 4316 Dozier St
- 4820 Eagle St
- 4326 Hammel St
- 606 S Kern Ave
- 4766 Hammel St
- 4656 Floral Dr
- 4077 San Carlos St
- 145 S Woods Ave
- 120 N Bonnie Beach Place
- 4532 E 2nd St
- 4540 E 2nd St
- 4528 E 2nd St
- 4544 E 2nd St
- 4524 E 2nd St
- 4548 E 2nd St
- 4545 E 3rd St
- 4535 E 2nd St Unit 4537 Front Unit
- 4535 E 2nd St Unit 4535
- 4535 E 2nd St Unit 4537A
- 4527 E 3rd St
- 4520 E 2nd St
- 4550 E 2nd St
- 4537 E 2nd St
- 4541 E 2nd St
- 4533 E 2nd St
- 4556 E 2nd St
- 4545 E 2nd St
- 4525 E 2nd St
- 4527 E 2nd St
Your Personal Tour Guide
Ask me questions while you tour the home.