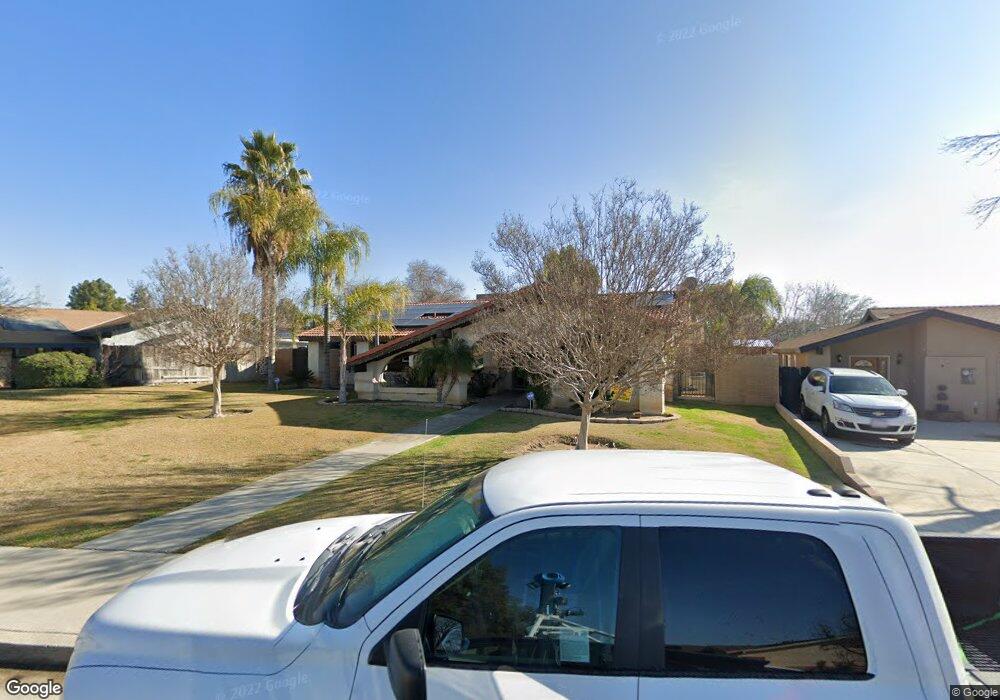
4536 Orrick Ct Bakersfield, CA 93308
Highland Knolls NeighborhoodEstimated Value: $357,798 - $382,000
3
Beds
2
Baths
1,635
Sq Ft
$226/Sq Ft
Est. Value
About This Home
This home is located at 4536 Orrick Ct, Bakersfield, CA 93308 and is currently estimated at $369,700, approximately $226 per square foot. 4536 Orrick Ct is a home located in Kern County with nearby schools including Highland Elementary School, Standard Middle School, and North High School.
Ownership History
Date
Name
Owned For
Owner Type
Purchase Details
Closed on
Apr 5, 2012
Sold by
Revo Brassfield Cindy Lee and Revo 2008 Cindy Lee Brassfield
Bought by
Brassfield Cindy Lee and Canales Israel Roberto
Current Estimated Value
Purchase Details
Closed on
Apr 17, 2008
Sold by
Brassfield Cindy L
Bought by
Revo Brassfield Cindy Lee and Revo 2008 Cindy Lee Brassfield
Purchase Details
Closed on
Mar 16, 2004
Sold by
Brassfield Cindy L and Brassfield Cynthia Lee
Bought by
Brassfield Cindy L
Home Financials for this Owner
Home Financials are based on the most recent Mortgage that was taken out on this home.
Original Mortgage
$55,000
Interest Rate
5.64%
Mortgage Type
New Conventional
Purchase Details
Closed on
Nov 10, 1999
Sold by
Sala Russell A
Bought by
Brassfield Cindy L
Purchase Details
Closed on
Mar 27, 1996
Sold by
Sala Jim
Bought by
Sala Lila
Purchase Details
Closed on
Nov 15, 1994
Sold by
Sala Jim Clarence
Bought by
Sala Jim C and Jim C Sala Trust
Create a Home Valuation Report for This Property
The Home Valuation Report is an in-depth analysis detailing your home's value as well as a comparison with similar homes in the area
Home Values in the Area
Average Home Value in this Area
Purchase History
| Date | Buyer | Sale Price | Title Company |
|---|---|---|---|
| Brassfield Cindy Lee | -- | None Available | |
| Revo Brassfield Cindy Lee | -- | None Available | |
| Brassfield Cindy L | -- | Stewart Title | |
| Brassfield Cindy L | -- | -- | |
| Sala Lila | -- | -- | |
| Sala Jim C | -- | -- |
Source: Public Records
Mortgage History
| Date | Status | Borrower | Loan Amount |
|---|---|---|---|
| Closed | Brassfield Cindy L | $55,000 |
Source: Public Records
Tax History
| Year | Tax Paid | Tax Assessment Tax Assessment Total Assessment is a certain percentage of the fair market value that is determined by local assessors to be the total taxable value of land and additions on the property. | Land | Improvement |
|---|---|---|---|---|
| 2025 | $3,206 | $193,414 | $33,235 | $160,179 |
| 2024 | $3,100 | $189,623 | $32,584 | $157,039 |
| 2023 | $3,100 | $185,907 | $31,946 | $153,961 |
| 2022 | $3,013 | $182,263 | $31,320 | $150,943 |
| 2021 | $2,920 | $178,691 | $30,706 | $147,985 |
| 2020 | $2,920 | $176,860 | $30,392 | $146,468 |
| 2019 | $2,780 | $176,860 | $30,392 | $146,468 |
| 2018 | $2,687 | $169,995 | $29,213 | $140,782 |
| 2017 | $2,673 | $166,663 | $28,641 | $138,022 |
| 2016 | $2,449 | $163,397 | $28,080 | $135,317 |
| 2015 | $2,411 | $160,945 | $27,659 | $133,286 |
| 2014 | $2,348 | $157,794 | $27,118 | $130,676 |
Source: Public Records
Map
Nearby Homes
- 913 Mcginley Ave
- 4413 Mccray St
- 348 Petrol Rd Unit 394
- 348 Petrol Rd Unit 366
- 376 Petrol Rd
- 4607 Skye Dr
- 4224 Orrick Ct
- 900 James Rd Unit 11
- 900 James Rd Unit 17
- 4218 Orrick Ct
- 33 Tee Ln
- 4884 Greenview Ln
- 4501 Knoll Dr
- 4824 Greenview Ln
- 4512 Skye Dr
- 65 Eagle Ln
- 4873 Putter Ln
- 43 Divot Ln
- 9 Tee Ln
- 41 Divot Ln
- 4530 Orrick Ct
- 4600 Orrick Ct
- 4524 Orrick Ct
- 4531 Mccray St
- 4601 Mccray St
- 4525 Mccray St
- 4531 Orrick Ct
- 4537 Orrick Ct
- 4607 Mccray St
- 4518 Orrick Ct
- 4525 Orrick Ct
- 4519 Mccray St
- 4601 Orrick Ct
- 4607 Orrick Ct
- 4613 Mccray St
- 4513 Mccray St
- 901 Mcginley Ave
- 4536 Mcginnis St
- 4530 Mcginnis St
- 4530 Mccray St
Your Personal Tour Guide
Ask me questions while you tour the home.