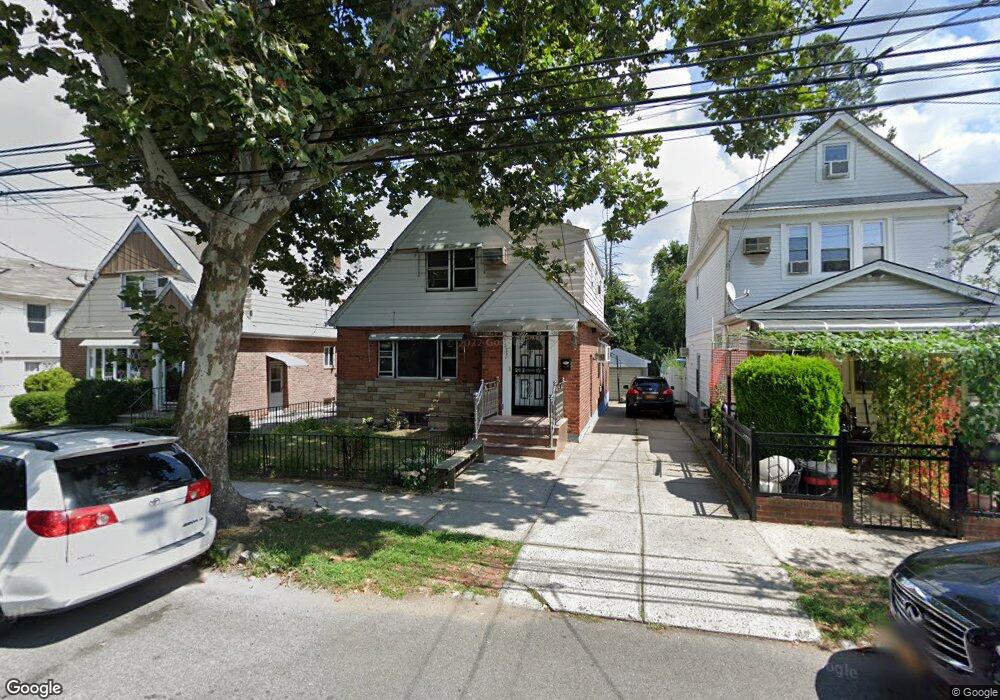
4537 156th St Flushing, NY 11355
Flushing NeighborhoodEstimated Value: $1,120,859 - $1,581,000
--
Bed
--
Bath
1,630
Sq Ft
$826/Sq Ft
Est. Value
About This Home
This home is located at 4537 156th St, Flushing, NY 11355 and is currently estimated at $1,346,965, approximately $826 per square foot. 4537 156th St is a home located in Queens County with nearby schools including P.S. 22 - Thomas Jefferson, Rachel Carson I.S. 237Q, and Francis Lewis High School.
Ownership History
Date
Name
Owned For
Owner Type
Purchase Details
Closed on
Jun 1, 2022
Sold by
Kaur Jatinder and Singh Harjinder
Bought by
Kaur Jatinder and Singh Harjinder
Current Estimated Value
Purchase Details
Closed on
Sep 24, 2014
Sold by
Bhogal Dalvir Singh and Singh Harjinder
Bought by
Kaur Jatinder and Singh Harjinder
Home Financials for this Owner
Home Financials are based on the most recent Mortgage that was taken out on this home.
Original Mortgage
$462,000
Outstanding Balance
$353,168
Interest Rate
4.1%
Mortgage Type
New Conventional
Estimated Equity
$993,797
Purchase Details
Closed on
Feb 9, 2001
Sold by
Muller Gunther F and Muller Lorraine
Bought by
Singh Harjinder and Bhogal Dalvir Singh
Home Financials for this Owner
Home Financials are based on the most recent Mortgage that was taken out on this home.
Original Mortgage
$345,000
Interest Rate
7.01%
Create a Home Valuation Report for This Property
The Home Valuation Report is an in-depth analysis detailing your home's value as well as a comparison with similar homes in the area
Home Values in the Area
Average Home Value in this Area
Purchase History
| Date | Buyer | Sale Price | Title Company |
|---|---|---|---|
| Kaur Jatinder | -- | -- | |
| Kaur Jatinder | -- | -- | |
| Kaur Jatinder | -- | -- | |
| Kaur Jatinder | -- | -- | |
| Singh Harjinder | $460,000 | -- | |
| Singh Harjinder | $460,000 | -- |
Source: Public Records
Mortgage History
| Date | Status | Borrower | Loan Amount |
|---|---|---|---|
| Open | Kaur Jatinder | $462,000 | |
| Closed | Kaur Jatinder | $462,000 | |
| Previous Owner | Singh Harjinder | $345,000 |
Source: Public Records
Tax History Compared to Growth
Tax History
| Year | Tax Paid | Tax Assessment Tax Assessment Total Assessment is a certain percentage of the fair market value that is determined by local assessors to be the total taxable value of land and additions on the property. | Land | Improvement |
|---|---|---|---|---|
| 2025 | $9,835 | $51,158 | $14,095 | $37,063 |
| 2024 | $9,835 | $48,968 | $13,332 | $35,636 |
| 2023 | $9,515 | $47,376 | $12,399 | $34,977 |
| 2022 | $9,458 | $75,840 | $19,440 | $56,400 |
| 2021 | $9,510 | $67,440 | $19,440 | $48,000 |
| 2020 | $9,024 | $65,700 | $19,440 | $46,260 |
| 2019 | $8,536 | $64,380 | $19,440 | $44,940 |
| 2018 | $8,048 | $39,480 | $12,817 | $26,663 |
| 2017 | $8,048 | $39,480 | $14,636 | $24,844 |
| 2016 | $7,528 | $39,480 | $14,636 | $24,844 |
| 2015 | $4,272 | $35,527 | $15,868 | $19,659 |
| 2014 | $4,272 | $34,006 | $17,564 | $16,442 |
Source: Public Records
Map
Nearby Homes
- 45-57 157th St
- 45-11 157th St
- 45-19 158th St
- 149-31 45th Ave
- 43-63 159th St
- 43-23 156th St
- 45-73 Parsons Blvd
- 45-57 160th St
- 45-65 Parsons Blvd
- 46-43 157th St
- 45-11 160th St
- 45-53 Parsons Blvd
- 148-11 Kalmia Ave
- 45-14 161st St
- 148-24 Kalmia Ave
- 14824 Kalmia Ave
- 43-04 158th St Unit 3E
- 43-04 158th St Unit L2
- 148-10 Kalmia Ave
- 4304 158th St Unit L4