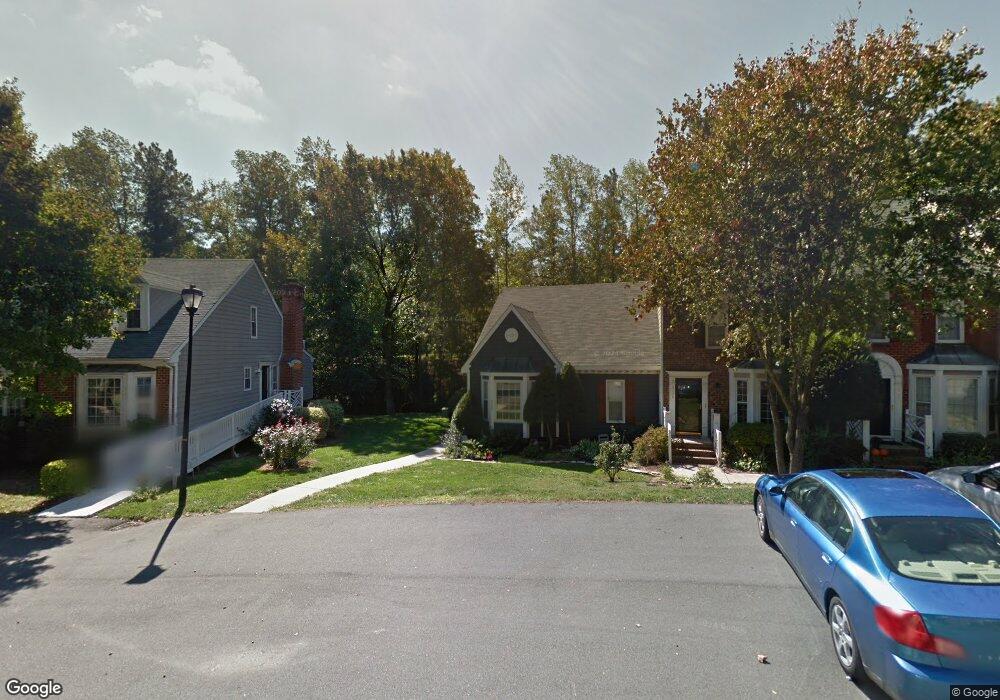
4537 Hershey Ct Raleigh, NC 27613
Northwest Raleigh NeighborhoodEstimated Value: $273,000 - $305,000
2
Beds
2
Baths
1,105
Sq Ft
$264/Sq Ft
Est. Value
About This Home
This home is located at 4537 Hershey Ct, Raleigh, NC 27613 and is currently estimated at $292,064, approximately $264 per square foot. 4537 Hershey Ct is a home located in Wake County with nearby schools including Hilburn Academy, Leesville Road High School, and The Montessori School of Raleigh.
Ownership History
Date
Name
Owned For
Owner Type
Purchase Details
Closed on
Sep 15, 2017
Sold by
Hines Barrett and Hines Allison C
Bought by
Griffin Holly B
Current Estimated Value
Home Financials for this Owner
Home Financials are based on the most recent Mortgage that was taken out on this home.
Original Mortgage
$170,500
Outstanding Balance
$145,045
Interest Rate
4.62%
Mortgage Type
Adjustable Rate Mortgage/ARM
Estimated Equity
$147,019
Purchase Details
Closed on
Apr 30, 2008
Sold by
Tousey Tim A and Tousey Jennifer M
Bought by
Hines Barrett
Home Financials for this Owner
Home Financials are based on the most recent Mortgage that was taken out on this home.
Original Mortgage
$137,837
Interest Rate
5.84%
Mortgage Type
FHA
Purchase Details
Closed on
Oct 2, 2002
Sold by
Bobbitt Lisa L
Bought by
Tousey Tim A and Tousey Jennifer M
Home Financials for this Owner
Home Financials are based on the most recent Mortgage that was taken out on this home.
Original Mortgage
$118,000
Interest Rate
6.27%
Create a Home Valuation Report for This Property
The Home Valuation Report is an in-depth analysis detailing your home's value as well as a comparison with similar homes in the area
Home Values in the Area
Average Home Value in this Area
Purchase History
| Date | Buyer | Sale Price | Title Company |
|---|---|---|---|
| Griffin Holly B | $173,000 | None Available | |
| Hines Barrett | $140,000 | None Available | |
| Tousey Tim A | $118,000 | -- |
Source: Public Records
Mortgage History
| Date | Status | Borrower | Loan Amount |
|---|---|---|---|
| Open | Griffin Holly B | $170,500 | |
| Previous Owner | Hines Barrett | $137,837 | |
| Previous Owner | Tousey Tim A | $118,000 |
Source: Public Records
Tax History Compared to Growth
Tax History
| Year | Tax Paid | Tax Assessment Tax Assessment Total Assessment is a certain percentage of the fair market value that is determined by local assessors to be the total taxable value of land and additions on the property. | Land | Improvement |
|---|---|---|---|---|
| 2025 | $2,553 | $290,484 | $100,000 | $190,484 |
| 2024 | $2,543 | $290,484 | $100,000 | $190,484 |
| 2023 | $2,047 | $185,952 | $35,000 | $150,952 |
| 2022 | $1,903 | $185,952 | $35,000 | $150,952 |
| 2021 | $1,829 | $185,952 | $35,000 | $150,952 |
| 2020 | $1,796 | $185,952 | $35,000 | $150,952 |
| 2019 | $1,583 | $134,883 | $35,000 | $99,883 |
| 2018 | $1,494 | $134,883 | $35,000 | $99,883 |
| 2017 | $1,423 | $134,883 | $35,000 | $99,883 |
| 2016 | $1,394 | $134,883 | $35,000 | $99,883 |
| 2015 | $1,385 | $131,808 | $31,500 | $100,308 |
| 2014 | $1,314 | $131,808 | $31,500 | $100,308 |
Source: Public Records
Map
Nearby Homes
- 4541 Hershey Ct
- 4536 Hamptonshire Dr
- 4424 Tetbury Place
- 6736 Hammersmith Dr
- 6036 Epping Forest Dr
- 4416 Lancashire Dr
- 7108 Sandringham Dr
- 6600 Coach Light Cir
- 6648 Mafolie Ct
- 6051 Epping Forest Dr
- 4103 Landfall Ct
- 6928 Leesville Rd
- 6422 Tanner Oak Ln
- 6420 Tanner Oak Ln
- 4104 Betterton Dr
- 6408 Tanner Oak Ln
- 502 Plumleaf Rd
- 104 Oak Hollow Ct Unit 104
- 4211 Norman Ridge Ln
- 401 Oak Hollow Ct Unit 401
- 4539 Hershey Ct
- 4533 Hershey Ct
- 4543 Hershey Ct
- 4545 Hershey Ct
- 4531 Hershey Ct Unit L63
- 4529 Hershey Ct
- 4547 Hershey Ct
- 4527 Hershey Ct
- 4525 Hershey Ct
- 4522 Hershey Ct Unit H49
- 4603 Hershey Ct
- 6800 Daltrey Ct
- 4520 Hershey Ct
- 4521 Hershey Ct
- 4519 Hershey Ct
- 6802 Daltrey Ct Unit V123
- 4517 Hershey Ct
- 4605 Hershey Ct
- 4518 Hershey Ct
- 4515 Hershey Ct Unit 56