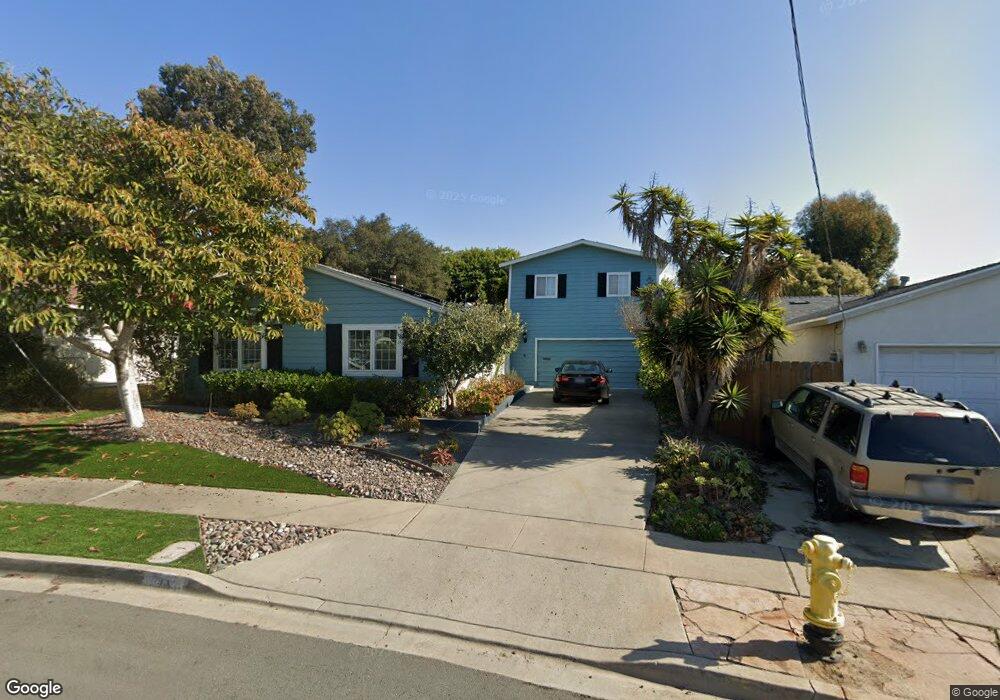
4537 Mount Henry Place San Diego, CA 92117
Clairemont Mesa West NeighborhoodEstimated Value: $1,237,000 - $1,642,000
5
Beds
3
Baths
3,031
Sq Ft
$473/Sq Ft
Est. Value
About This Home
This home is located at 4537 Mount Henry Place, San Diego, CA 92117 and is currently estimated at $1,435,027, approximately $473 per square foot. 4537 Mount Henry Place is a home located in San Diego County with nearby schools including Holmes Elementary, Marston Middle School, and Clairemont High School.
Ownership History
Date
Name
Owned For
Owner Type
Purchase Details
Closed on
Feb 23, 2009
Sold by
Rudie Kathleen G
Bought by
Rudie Kathleen G
Current Estimated Value
Home Financials for this Owner
Home Financials are based on the most recent Mortgage that was taken out on this home.
Original Mortgage
$292,000
Outstanding Balance
$182,695
Interest Rate
4.91%
Mortgage Type
New Conventional
Estimated Equity
$1,252,332
Purchase Details
Closed on
Mar 5, 2008
Sold by
Rudie Kathleen G
Bought by
Rudie Kathleen G
Purchase Details
Closed on
Dec 17, 2007
Sold by
Rudie David J
Bought by
Rudie Kathleen G
Purchase Details
Closed on
Sep 8, 1998
Sold by
Rudie David J and Rudie Kathleen D
Bought by
Rudie David J and Rudie Kathleen G
Home Financials for this Owner
Home Financials are based on the most recent Mortgage that was taken out on this home.
Original Mortgage
$113,000
Interest Rate
6.57%
Purchase Details
Closed on
Mar 4, 1983
Create a Home Valuation Report for This Property
The Home Valuation Report is an in-depth analysis detailing your home's value as well as a comparison with similar homes in the area
Home Values in the Area
Average Home Value in this Area
Purchase History
| Date | Buyer | Sale Price | Title Company |
|---|---|---|---|
| Rudie Kathleen G | -- | Accommodation | |
| Rudie Kathleen G | -- | Multiple | |
| Rudie Kathleen G | -- | None Available | |
| Rudie Kathleen G | -- | None Available | |
| Rudie Kathleen G | -- | None Available | |
| Rudie David J | -- | American Title Co | |
| Rudie David J | -- | American Title Co | |
| -- | $99,000 | -- |
Source: Public Records
Mortgage History
| Date | Status | Borrower | Loan Amount |
|---|---|---|---|
| Open | Rudie Kathleen G | $292,000 | |
| Previous Owner | Rudie David J | $113,000 | |
| Previous Owner | Rudie David J | $200,000 | |
| Closed | Rudie David J | $199,500 |
Source: Public Records
Tax History Compared to Growth
Tax History
| Year | Tax Paid | Tax Assessment Tax Assessment Total Assessment is a certain percentage of the fair market value that is determined by local assessors to be the total taxable value of land and additions on the property. | Land | Improvement |
|---|---|---|---|---|
| 2025 | $4,269 | $351,622 | $64,415 | $287,207 |
| 2024 | $4,269 | $344,728 | $63,152 | $281,576 |
| 2023 | $4,174 | $337,969 | $61,914 | $276,055 |
| 2022 | $4,063 | $331,343 | $60,700 | $270,643 |
| 2021 | $4,036 | $324,847 | $59,510 | $265,337 |
| 2020 | $3,987 | $321,517 | $58,900 | $262,617 |
| 2019 | $3,916 | $315,214 | $57,746 | $257,468 |
| 2018 | $3,580 | $309,034 | $56,614 | $252,420 |
| 2017 | $81 | $302,975 | $55,504 | $247,471 |
| 2016 | $3,435 | $297,035 | $54,416 | $242,619 |
| 2015 | $3,384 | $292,574 | $53,599 | $238,975 |
| 2014 | $3,330 | $286,844 | $52,550 | $234,294 |
Source: Public Records
Map
Nearby Homes
- 4226 Mount Voss Dr
- 4380 Rolfe Rd
- 4203 Tolowa St
- 4182 Seri St
- 4472 Mount Lindsey Ave
- 4695 Mount Armet Dr
- 4772 Mount Gaywas Dr
- 4915 Mount Gaywas Dr
- 4141 Mount Bigelow Way
- 4527 Chinook Ct
- 4575 Chateau Dr
- 4576 Onondaga Ave
- 3701 Tavara Cir
- 3582 Hatteras Ave
- 3571 Idlewild Way
- 5230 Mount Alifan Dr
- 4150 Taos Dr
- 4501 Bannock Ave
- 4781 Boise Ave
- 5377 Balboa Ave
- 4529 Mount Henry Place
- 4545 Mount Henry Place
- 4310 Mount Henry Ave
- 4316 Mount Henry Ave
- 4521 Mount Henry Place
- 4555 Mount Henry Place
- 4302 Mount Henry Ave
- 4324 Mount Henry Ave
- 4536 Mount Henry Place
- 4330 Mount Henry Ave
- 4296 Mount Henry Ave
- 4565 Mount Henry Place
- 4513 Mount Henry Place
- 4552 Mount Henry Place
- 4284 Mount Henry Ave
- 4520 Mount Henry Place
- 4595 Mount Henry Place
- 4560 Mount Henry Place
- 4317 Mount Henry Ave
- 4510 Mount Henry Place