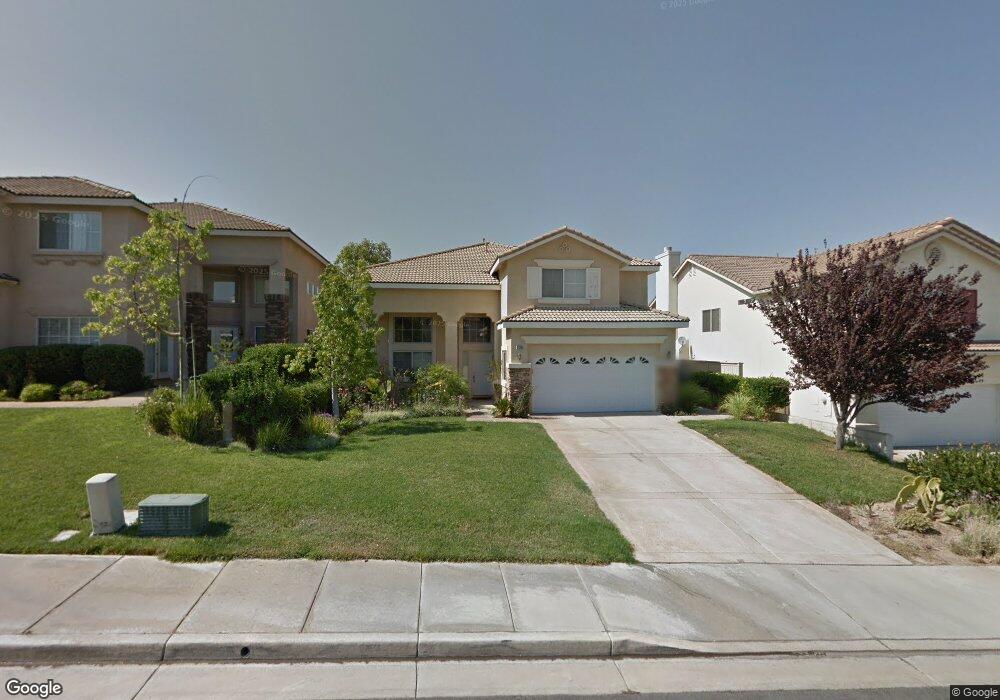
45389 Eagle Crest Ln Temecula, CA 92592
Redhawk NeighborhoodEstimated Value: $746,000 - $914,000
4
Beds
3
Baths
2,632
Sq Ft
$305/Sq Ft
Est. Value
About This Home
This home is located at 45389 Eagle Crest Ln, Temecula, CA 92592 and is currently estimated at $803,429, approximately $305 per square foot. 45389 Eagle Crest Ln is a home located in Riverside County with nearby schools including Tony Tobin Elementary School, Vail Ranch Middle School, and Great Oak High School.
Ownership History
Date
Name
Owned For
Owner Type
Purchase Details
Closed on
Feb 22, 2010
Sold by
Dang Giang B
Bought by
Bryant Hang N
Current Estimated Value
Purchase Details
Closed on
Jul 28, 2009
Sold by
Bryant Hang Nguyet
Bought by
Dang Giang Binh
Purchase Details
Closed on
Mar 3, 2009
Sold by
Bryant Hang N
Bought by
Dang My H
Purchase Details
Closed on
Jul 16, 2006
Sold by
Dang Giang Binh
Bought by
Bryant Hang N
Purchase Details
Closed on
Feb 1, 2005
Sold by
Dang Giang B
Bought by
Dang Giang Binh and Giang Binh Dang Trust
Purchase Details
Closed on
May 10, 2002
Sold by
Lenone Inc
Bought by
Dang Giang B
Home Financials for this Owner
Home Financials are based on the most recent Mortgage that was taken out on this home.
Original Mortgage
$256,000
Interest Rate
6.89%
Purchase Details
Closed on
May 18, 2000
Sold by
U S Home Corp
Bought by
Lenone Inc
Create a Home Valuation Report for This Property
The Home Valuation Report is an in-depth analysis detailing your home's value as well as a comparison with similar homes in the area
Home Values in the Area
Average Home Value in this Area
Purchase History
| Date | Buyer | Sale Price | Title Company |
|---|---|---|---|
| Bryant Hang N | $150,000 | None Available | |
| Dang Giang Binh | -- | None Available | |
| Dang My H | $50,000 | None Available | |
| Bryant Hang N | -- | None Available | |
| Dang Giang Binh | -- | None Available | |
| Dang Giang B | $320,000 | North American Title Co | |
| Lenone Inc | $319,500 | Stewart Title |
Source: Public Records
Mortgage History
| Date | Status | Borrower | Loan Amount |
|---|---|---|---|
| Previous Owner | Dang Giang B | $256,000 |
Source: Public Records
Tax History
| Year | Tax Paid | Tax Assessment Tax Assessment Total Assessment is a certain percentage of the fair market value that is determined by local assessors to be the total taxable value of land and additions on the property. | Land | Improvement |
|---|---|---|---|---|
| 2025 | $6,795 | $472,709 | $118,171 | $354,538 |
| 2023 | $6,795 | $454,355 | $113,583 | $340,772 |
| 2022 | $6,574 | $445,447 | $111,356 | $334,091 |
| 2021 | $6,437 | $436,714 | $109,173 | $327,541 |
| 2020 | $6,350 | $432,237 | $108,054 | $324,183 |
| 2019 | $6,257 | $423,763 | $105,936 | $317,827 |
| 2018 | $6,133 | $415,455 | $103,859 | $311,596 |
| 2017 | $6,020 | $407,310 | $101,823 | $305,487 |
| 2016 | $5,903 | $399,325 | $99,827 | $299,498 |
| 2015 | $5,795 | $393,329 | $98,329 | $295,000 |
| 2014 | $5,631 | $385,625 | $96,403 | $289,222 |
Source: Public Records
Map
Nearby Homes
- 33370 Morning View Dr
- 33413 Alagon St
- 33332 Kilroy Rd
- 45405 Vanowen Ln
- 45160 Jumi Cir
- 33294 Barmetta Ln
- 33360 Barrington Dr
- 33710 Sattui St
- 0 Monte Verde Unit WS26037370
- 32986 Anasazi Dr
- 33123 Yucca St
- 45659 Bassett St
- 33792 Baystone St
- 45211 Tioga St
- 33845 Sattui St
- 45055 Rutherford St
- 32815 Cleveland St
- 45316 Saint Tisbury St
- 45854 Corte Mislanca
- 44797 Corte Sanchez
- 45381 Eagle Crest Ln
- 45397 Eagle Crest Ln
- 45405 Eagle Crest Ln
- 45373 Eagle Crest Ln
- 45413 Eagle Crest Ln
- 45386 Eagle Crest Ln
- 45394 Eagle Crest Ln
- 45378 Eagle Crest Ln
- 45370 Eagle Crest Ln
- 45402 Eagle Crest Ln
- 45421 Eagle Crest Ln
- 45357 Quail Crest Dr
- 45344 Escalon St Unit 8
- 45332 Escalon St
- 33439 Decada St
- 45320 Escalon St
- 45356 Escalon St
- 33281 Eastridge Place
- 33242 Morning View Dr
- 45308 Escalon St
Your Personal Tour Guide
Ask me questions while you tour the home.