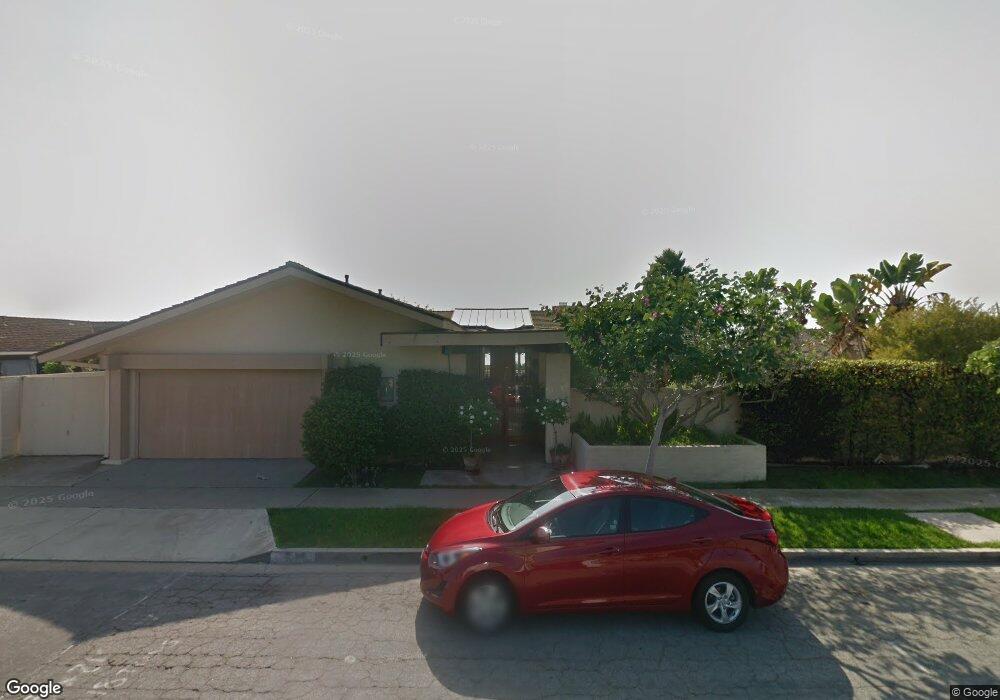
4539 Roxbury Rd Corona Del Mar, CA 92625
Corona Del Mar NeighborhoodEstimated Value: $5,945,231 - $6,991,000
3
Beds
3
Baths
3,073
Sq Ft
$2,135/Sq Ft
Est. Value
About This Home
This home is located at 4539 Roxbury Rd, Corona Del Mar, CA 92625 and is currently estimated at $6,561,077, approximately $2,135 per square foot. 4539 Roxbury Rd is a home located in Orange County with nearby schools including Harbor View Elementary School, Corona del Mar Middle and High School, and Harbor Day School.
Ownership History
Date
Name
Owned For
Owner Type
Purchase Details
Closed on
Oct 23, 2002
Sold by
Hermanson Jeffrey F and Sweek William L
Bought by
Hermanson Jeffrey F
Current Estimated Value
Purchase Details
Closed on
Dec 16, 1996
Sold by
Hermanson Esther R
Bought by
Hermanson Esther R and Hermanson Jeffrey F
Purchase Details
Closed on
Jun 15, 1995
Sold by
Hermanson David O
Bought by
Hermanson Esther R
Home Financials for this Owner
Home Financials are based on the most recent Mortgage that was taken out on this home.
Original Mortgage
$945,000
Interest Rate
7.62%
Purchase Details
Closed on
Apr 4, 1995
Sold by
Bromiley Lee I and Bromiley Diana C
Bought by
Hermanson Esther R
Create a Home Valuation Report for This Property
The Home Valuation Report is an in-depth analysis detailing your home's value as well as a comparison with similar homes in the area
Home Values in the Area
Average Home Value in this Area
Purchase History
| Date | Buyer | Sale Price | Title Company |
|---|---|---|---|
| Hermanson Jeffrey F | -- | -- | |
| Hermanson Esther R | -- | -- | |
| Hermanson Esther R | -- | Fidelity National Title Ins | |
| Hermanson Esther R | $1,260,000 | Fidelity National Title Ins |
Source: Public Records
Mortgage History
| Date | Status | Borrower | Loan Amount |
|---|---|---|---|
| Closed | Hermanson Esther R | $945,000 |
Source: Public Records
Tax History Compared to Growth
Tax History
| Year | Tax Paid | Tax Assessment Tax Assessment Total Assessment is a certain percentage of the fair market value that is determined by local assessors to be the total taxable value of land and additions on the property. | Land | Improvement |
|---|---|---|---|---|
| 2025 | $22,261 | $2,119,800 | $1,816,521 | $303,279 |
| 2024 | $22,261 | $2,078,236 | $1,780,903 | $297,333 |
| 2023 | $21,739 | $2,037,487 | $1,745,984 | $291,503 |
| 2022 | $21,378 | $1,997,537 | $1,711,749 | $285,788 |
| 2021 | $20,969 | $1,958,370 | $1,678,185 | $280,185 |
| 2020 | $20,768 | $1,938,290 | $1,660,977 | $277,313 |
| 2019 | $20,338 | $1,900,285 | $1,628,409 | $271,876 |
| 2018 | $19,933 | $1,863,025 | $1,596,479 | $266,546 |
| 2017 | $19,581 | $1,826,496 | $1,565,176 | $261,320 |
| 2016 | $19,142 | $1,790,683 | $1,534,486 | $256,197 |
| 2015 | $18,961 | $1,763,786 | $1,511,437 | $252,349 |
| 2014 | $18,515 | $1,729,236 | $1,481,830 | $247,406 |
Source: Public Records
Map
Nearby Homes
- 4512 Roxbury Rd
- 4521 Orrington Rd
- 4633 Orrington Rd
- 333 Milford Dr
- 4709 Hampden Rd
- 251 Driftwood Rd
- 177 Shorecliff Rd
- 552 Seaward Rd
- 420 De Sola Terrace
- 424 Mendoza Terrace
- 504 Hazel Dr
- 445 Isabella Terrace
- 216 Poppy Ave
- 412 Poinsettia Ave
- 410 1/2 Poinsettia Ave
- 316 Orchid Ave
- 222 Orchid Ave
- 3731 5th Ave
- 720 1/2 Poinsettia Ave
- 3720 Lilac Ave Unit 61
- 4533 Roxbury Rd
- 4601 Roxbury Rd
- 4607 Roxbury Rd
- 4545 Fairfield Dr
- 4539 Fairfield Dr
- 4536 Roxbury Rd
- 4600 Roxbury Rd
- 4601 Fairfield Dr
- 4530 Roxbury Rd
- 4533 Fairfield Dr
- 4615 Roxbury Rd
- 4521 Roxbury Rd
- 4606 Roxbury Rd
- 4524 Roxbury Rd
- 4607 Fairfield Dr
- 4527 Fairfield Dr
- 4612 Roxbury Rd
- 4621 Roxbury Rd
- 4515 Roxbury Rd