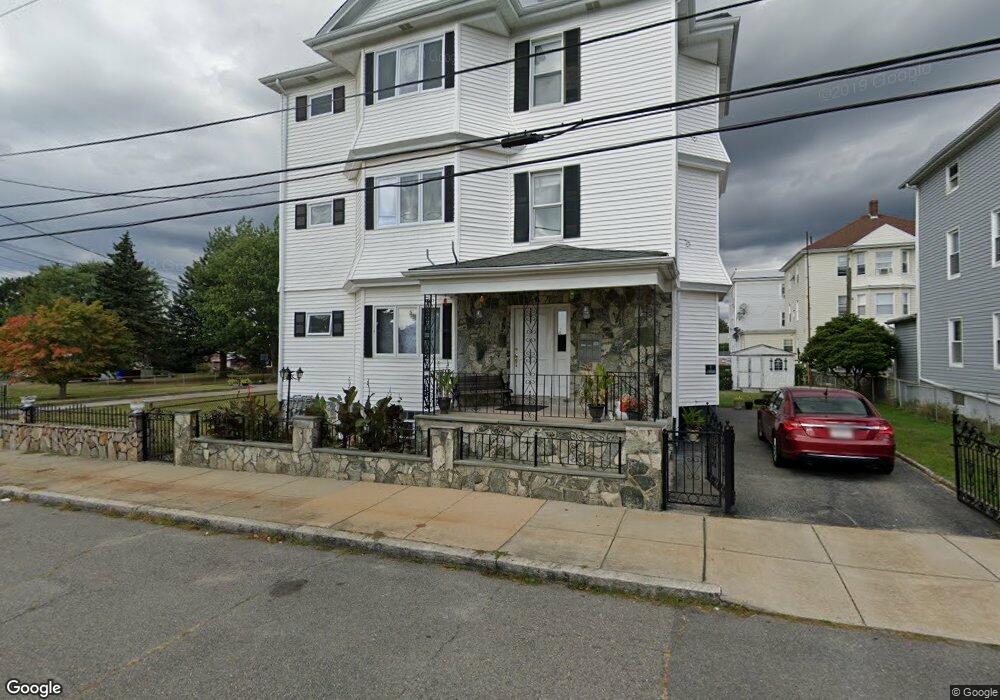
454 Birch St Fall River, MA 02724
Sandy Beach NeighborhoodEstimated Value: $666,000 - $725,000
9
Beds
3
Baths
3,462
Sq Ft
$201/Sq Ft
Est. Value
About This Home
This home is located at 454 Birch St, Fall River, MA 02724 and is currently estimated at $695,500, approximately $200 per square foot. 454 Birch St is a home located in Bristol County with nearby schools including Carlton M. Viveiros Elementary School, Matthew J. Kuss Middle School, and B M C Durfee High School.
Ownership History
Date
Name
Owned For
Owner Type
Purchase Details
Closed on
Mar 1, 2019
Sold by
Rebelo Floriano L and Leonardo Delfino F
Bought by
Ponte Maria L and Leonardo Delfino F
Current Estimated Value
Home Financials for this Owner
Home Financials are based on the most recent Mortgage that was taken out on this home.
Original Mortgage
$200,000
Outstanding Balance
$174,399
Interest Rate
4.4%
Mortgage Type
New Conventional
Estimated Equity
$521,101
Purchase Details
Closed on
Jan 7, 2019
Sold by
Rebelo Ana
Bought by
Teixeira Helena
Home Financials for this Owner
Home Financials are based on the most recent Mortgage that was taken out on this home.
Original Mortgage
$200,000
Outstanding Balance
$174,399
Interest Rate
4.4%
Mortgage Type
New Conventional
Estimated Equity
$521,101
Create a Home Valuation Report for This Property
The Home Valuation Report is an in-depth analysis detailing your home's value as well as a comparison with similar homes in the area
Home Values in the Area
Average Home Value in this Area
Purchase History
| Date | Buyer | Sale Price | Title Company |
|---|---|---|---|
| Ponte Maria L | $200,000 | -- | |
| Ponte Maria L | $200,000 | -- | |
| Teixeira Helena | -- | -- | |
| Teixeira Helena | -- | -- |
Source: Public Records
Mortgage History
| Date | Status | Borrower | Loan Amount |
|---|---|---|---|
| Open | Ponte Maria L | $200,000 | |
| Closed | Ponte Maria L | $200,000 |
Source: Public Records
Tax History
| Year | Tax Paid | Tax Assessment Tax Assessment Total Assessment is a certain percentage of the fair market value that is determined by local assessors to be the total taxable value of land and additions on the property. | Land | Improvement |
|---|---|---|---|---|
| 2025 | $6,023 | $526,000 | $126,600 | $399,400 |
| 2024 | $5,761 | $501,400 | $121,800 | $379,600 |
| 2023 | $5,182 | $422,300 | $104,400 | $317,900 |
| 2022 | $4,557 | $361,100 | $94,900 | $266,200 |
| 2021 | $4,282 | $309,600 | $87,900 | $221,700 |
| 2020 | $3,821 | $264,400 | $84,100 | $180,300 |
| 2019 | $3,246 | $222,600 | $80,100 | $142,500 |
| 2018 | $3,016 | $206,300 | $78,600 | $127,700 |
| 2017 | $2,911 | $207,900 | $80,200 | $127,700 |
| 2016 | $2,835 | $208,000 | $83,500 | $124,500 |
| 2015 | $2,680 | $204,900 | $80,400 | $124,500 |
| 2014 | $2,785 | $221,400 | $84,700 | $136,700 |
Source: Public Records
Map
Nearby Homes
Your Personal Tour Guide
Ask me questions while you tour the home.