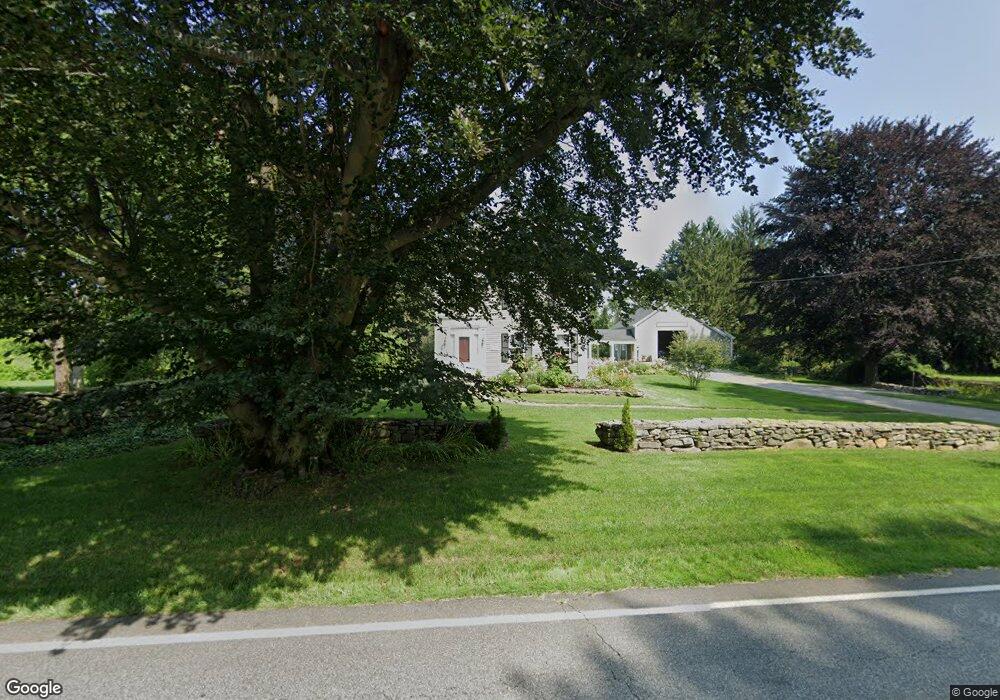
454 Boston Rd Sutton, MA 01590
Estimated Value: $741,452 - $1,119,000
4
Beds
3
Baths
2,883
Sq Ft
$308/Sq Ft
Est. Value
About This Home
This home is located at 454 Boston Rd, Sutton, MA 01590 and is currently estimated at $887,863, approximately $307 per square foot. 454 Boston Rd is a home located in Worcester County with nearby schools including Sutton Elementary School, Sutton Middle School, and Sutton High School.
Ownership History
Date
Name
Owned For
Owner Type
Purchase Details
Closed on
Feb 15, 2019
Sold by
Morgan George R and Morgan Susan
Bought by
Morgan-Daivs Irt
Current Estimated Value
Purchase Details
Closed on
Oct 5, 1999
Sold by
Colorio Janice A
Bought by
Parmenter Terri A
Home Financials for this Owner
Home Financials are based on the most recent Mortgage that was taken out on this home.
Original Mortgage
$90,150
Interest Rate
7.85%
Mortgage Type
Purchase Money Mortgage
Purchase Details
Closed on
Apr 20, 1994
Sold by
Bell Peter M and Joan Bell N
Bought by
Morgan George R and Davis Susan
Purchase Details
Closed on
Oct 16, 1987
Sold by
Maclaren J Edward W
Bought by
Bell Peter M
Create a Home Valuation Report for This Property
The Home Valuation Report is an in-depth analysis detailing your home's value as well as a comparison with similar homes in the area
Home Values in the Area
Average Home Value in this Area
Purchase History
| Date | Buyer | Sale Price | Title Company |
|---|---|---|---|
| Morgan-Daivs Irt | -- | -- | |
| Parmenter Terri A | $94,900 | -- | |
| Morgan George R | $311,000 | -- | |
| Bell Peter M | $277,000 | -- |
Source: Public Records
Mortgage History
| Date | Status | Borrower | Loan Amount |
|---|---|---|---|
| Previous Owner | Bell Peter M | $215,100 | |
| Previous Owner | Bell Peter M | $90,150 | |
| Previous Owner | Bell Peter M | $40,000 |
Source: Public Records
Tax History
| Year | Tax Paid | Tax Assessment Tax Assessment Total Assessment is a certain percentage of the fair market value that is determined by local assessors to be the total taxable value of land and additions on the property. | Land | Improvement |
|---|---|---|---|---|
| 2025 | $8,104 | $674,200 | $202,100 | $472,100 |
| 2024 | $7,780 | $613,600 | $191,600 | $422,000 |
| 2023 | $7,955 | $574,400 | $174,800 | $399,600 |
| 2022 | $8,817 | $580,800 | $135,800 | $445,000 |
| 2021 | $7,718 | $482,400 | $135,800 | $346,600 |
| 2020 | $7,651 | $482,400 | $135,800 | $346,600 |
| 2019 | $7,451 | $451,000 | $135,800 | $315,200 |
| 2018 | $7,464 | $451,000 | $135,800 | $315,200 |
| 2017 | $7,291 | $441,900 | $120,600 | $321,300 |
| 2016 | $7,371 | $441,900 | $120,600 | $321,300 |
| 2015 | $7,114 | $426,500 | $120,600 | $305,900 |
| 2014 | $7,405 | $438,700 | $126,900 | $311,800 |
Source: Public Records
Map
Nearby Homes
- 354 W Sutton Rd
- 5 Putnam Hill Rd
- 109 Mendon Rd
- 5 Hamlets Way
- 186 8 Lots Rd
- 31 Central Turnpike
- 51 Central Turnpike
- 24 Manchaug Rd
- 1 Burbank Rd
- 266 Putnam Hill Rd
- 198 Uxbridge Rd
- 99 Burbank Rd
- 99 Burbank Road Lot 182
- 37 Sutton Rd
- 11 Laurel Dr
- 303 W Main St
- 0 W Main St
- 168 Burbank Rd
- 196 Horne Way Unit 196
- 100 Horne Way
Your Personal Tour Guide
Ask me questions while you tour the home.