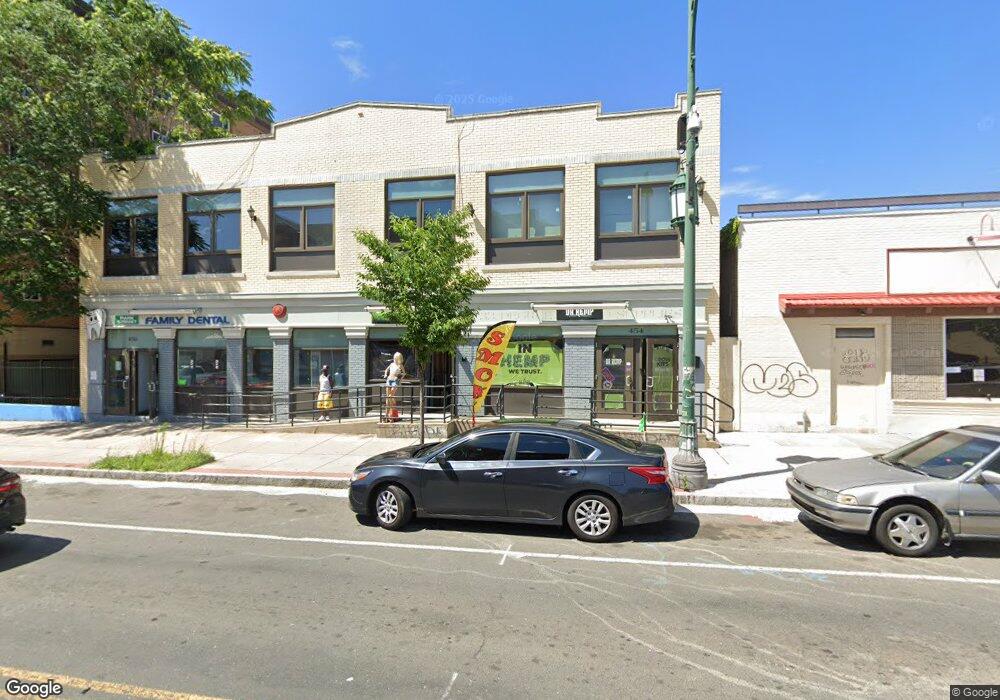
454 Park St Hartford, CT 06106
Frog Hollow NeighborhoodEstimated Value: $548,224
--
Bed
--
Bath
13,475
Sq Ft
$41/Sq Ft
Est. Value
About This Home
This home is located at 454 Park St, Hartford, CT 06106 and is currently estimated at $548,224, approximately $40 per square foot. 454 Park St is a home located in Hartford County with nearby schools including M. D. Fox School, Asian Studies School At Dwight/Belizzi School, and Dr. James H Naylor/Ccsu Leadership Academy.
Ownership History
Date
Name
Owned For
Owner Type
Purchase Details
Closed on
Oct 29, 2024
Sold by
Phoenix Tax Investors Llc
Bought by
Kemp Jayson
Current Estimated Value
Home Financials for this Owner
Home Financials are based on the most recent Mortgage that was taken out on this home.
Original Mortgage
$300,000
Outstanding Balance
$296,377
Interest Rate
6.09%
Mortgage Type
Purchase Money Mortgage
Estimated Equity
$251,847
Purchase Details
Closed on
Sep 28, 2023
Sold by
Lsf9 Master Part T and U S Bank Tna Tr
Bought by
Steere Shannon
Home Financials for this Owner
Home Financials are based on the most recent Mortgage that was taken out on this home.
Original Mortgage
$255,290
Interest Rate
7.09%
Mortgage Type
FHA
Purchase Details
Closed on
Mar 11, 2011
Sold by
American Tax Funding
Bought by
Phoenix Tax Investors
Create a Home Valuation Report for This Property
The Home Valuation Report is an in-depth analysis detailing your home's value as well as a comparison with similar homes in the area
Home Values in the Area
Average Home Value in this Area
Purchase History
| Date | Buyer | Sale Price | Title Company |
|---|---|---|---|
| Kemp Jayson | $550,000 | None Available | |
| Kemp Jayson | $550,000 | None Available | |
| Steere Shannon | $260,000 | None Available | |
| Phoenix Tax Investors | -- | -- | |
| Phoenix Tax Investors | -- | -- |
Source: Public Records
Mortgage History
| Date | Status | Borrower | Loan Amount |
|---|---|---|---|
| Open | Kemp Jayson | $300,000 | |
| Closed | Kemp Jayson | $300,000 | |
| Previous Owner | Steere Shannon | $255,290 | |
| Previous Owner | Phoenix Tax Investors | $160,000 | |
| Previous Owner | Phoenix Tax Investors | $650,000 |
Source: Public Records
Tax History Compared to Growth
Tax History
| Year | Tax Paid | Tax Assessment Tax Assessment Total Assessment is a certain percentage of the fair market value that is determined by local assessors to be the total taxable value of land and additions on the property. | Land | Improvement |
|---|---|---|---|---|
| 2025 | $24,516 | $338,380 | $37,030 | $301,350 |
| 2024 | $23,859 | $338,380 | $37,030 | $301,350 |
| 2023 | $24,516 | $338,380 | $37,030 | $301,350 |
| 2022 | $24,516 | $338,380 | $37,030 | $301,350 |
| 2021 | $19,059 | $245,000 | $138,950 | $106,050 |
| 2020 | $19,059 | $245,000 | $138,950 | $106,050 |
| 2019 | $19,059 | $245,000 | $138,950 | $106,050 |
| 2018 | $25,920 | $333,200 | $138,950 | $194,250 |
| 2016 | $13,796 | $185,710 | $104,650 | $81,060 |
| 2015 | $13,796 | $185,710 | $104,650 | $81,060 |
| 2014 | $13,796 | $185,710 | $104,650 | $81,060 |
Source: Public Records
Map
Nearby Homes
- 804 Broad St Unit 806
- 642 Park St Unit 648
- 155 Seymour St Unit 157
- 42 Madison St
- 263 Jefferson St
- 9 Madison St
- 133 Babcock St
- 30 Putnam St Unit 32
- 166 Ward St
- 39 Putnam St Unit 41
- 47 Putnam St
- 27 Allen Place
- 906 & 896 Park St
- 52 Buckingham St Unit 3
- 93 Elm St
- 25 Capitol Ave Unit C
- 31 Wethersfield Ave Unit I
- 2 Wethersfield Ave
- 51 Congress St Unit A
- 68 Morris St Unit 102
- 479 Park St
- 481 Park St Unit 495
- 17 Squire St
- 19 Squire St
- 488 Park St
- 24 Squire St Unit 26
- 10 Wolcott St
- 19-33 Lafayette St
- 30 Squire St
- 20 Wolcott St
- 19 Lafayette St
- 32 Squire St
- 507 Park St Unit 513
- 518 Park St
- 35 Squire St Unit C1
- 35 Squire St Unit C2
- 35 Squire St Unit C3
- 35 Squire St Unit B3
- 35 Squire St Unit B2
- 35 Squire St