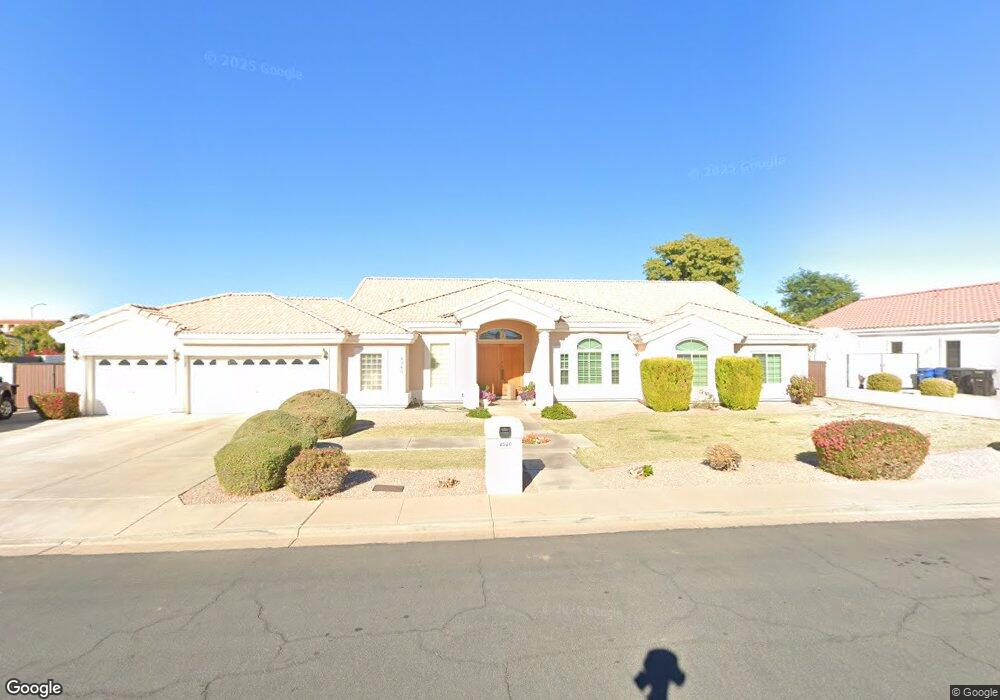
4540 E Encanto St Mesa, AZ 85205
Central Mesa East NeighborhoodEstimated Value: $730,982 - $910,000
Studio
4
Baths
3,127
Sq Ft
$268/Sq Ft
Est. Value
About This Home
This home is located at 4540 E Encanto St, Mesa, AZ 85205 and is currently estimated at $836,746, approximately $267 per square foot. 4540 E Encanto St is a home located in Maricopa County with nearby schools including O'Connor Elementary School, Franklin at Brimhall Elementary School, and Franklin West Elementary School.
Ownership History
Date
Name
Owned For
Owner Type
Purchase Details
Closed on
Apr 11, 1995
Sold by
Via Homes Inc
Bought by
Saveski Ivan and Saveski Ljupka
Current Estimated Value
Home Financials for this Owner
Home Financials are based on the most recent Mortgage that was taken out on this home.
Original Mortgage
$178,850
Interest Rate
8.6%
Mortgage Type
New Conventional
Purchase Details
Closed on
Apr 23, 1994
Sold by
Feuerstein Robert G and Feuerstein Carol
Bought by
Via Homes Inc
Create a Home Valuation Report for This Property
The Home Valuation Report is an in-depth analysis detailing your home's value as well as a comparison with similar homes in the area
Home Values in the Area
Average Home Value in this Area
Purchase History
| Date | Buyer | Sale Price | Title Company |
|---|---|---|---|
| Saveski Ivan | $238,500 | Chicago Title Insurance Co | |
| Via Homes Inc | $38,000 | Chicago Title Insurance Co |
Source: Public Records
Mortgage History
| Date | Status | Borrower | Loan Amount |
|---|---|---|---|
| Closed | Saveski Ivan | $178,850 |
Source: Public Records
Tax History
| Year | Tax Paid | Tax Assessment Tax Assessment Total Assessment is a certain percentage of the fair market value that is determined by local assessors to be the total taxable value of land and additions on the property. | Land | Improvement |
|---|---|---|---|---|
| 2025 | $3,403 | $39,885 | -- | -- |
| 2024 | $3,416 | $37,986 | -- | -- |
| 2023 | $3,416 | $51,510 | $10,300 | $41,210 |
| 2022 | $3,343 | $41,900 | $8,380 | $33,520 |
| 2021 | $3,421 | $40,880 | $8,170 | $32,710 |
| 2020 | $3,374 | $36,230 | $7,240 | $28,990 |
| 2019 | $3,130 | $34,450 | $6,890 | $27,560 |
| 2018 | $2,986 | $32,960 | $6,590 | $26,370 |
| 2017 | $2,894 | $32,630 | $6,520 | $26,110 |
| 2016 | $2,840 | $32,630 | $6,520 | $26,110 |
| 2015 | $2,678 | $30,930 | $6,180 | $24,750 |
Source: Public Records
Map
Nearby Homes
- 4562 E Elmwood St
- 4556 E Downing St
- 4335 E Fox Cir
- 4429 E Downing Cir
- 4326 E Fairbrook Cir
- 4622 E Des Moines St
- 4245 E Fountain St
- 4530 E Decatur St
- 4230 E Fountain St
- 4650 E Decatur St
- 4913 E Fox St
- 736 N Regent
- 4933 E Downing St
- 4906 E Brown Rd Unit 38
- 1244 N Norfolk Cir
- 1126 N Nassau
- 4528 E Hobart St
- 5135 E Evergreen St Unit 1165
- 5135 E Evergreen St Unit 1253
- 4038 E Glencove St
- 4550 E Encanto St
- 4533 E Fairfield Cir
- 4518 E Encanto St
- 4537 E Encanto St
- 4549 E Encanto St
- 4519 E Fairfield St
- 4525 E Encanto St
- 4547 E Fairfield Cir
- 4562 E Encanto St
- 4506 E Encanto St
- 4561 E Encanto St
- 4536 E Elmwood St
- 4513 E Encanto St
- 4505 E Fairfield St
- 4550 E Elmwood St
- 4534 E Fairfield Cir
- 4526 E Elmwood St
- 4548 E Fairfield Cir
- 4520 E Fairfield St
- 953 N Quinn
Your Personal Tour Guide
Ask me questions while you tour the home.