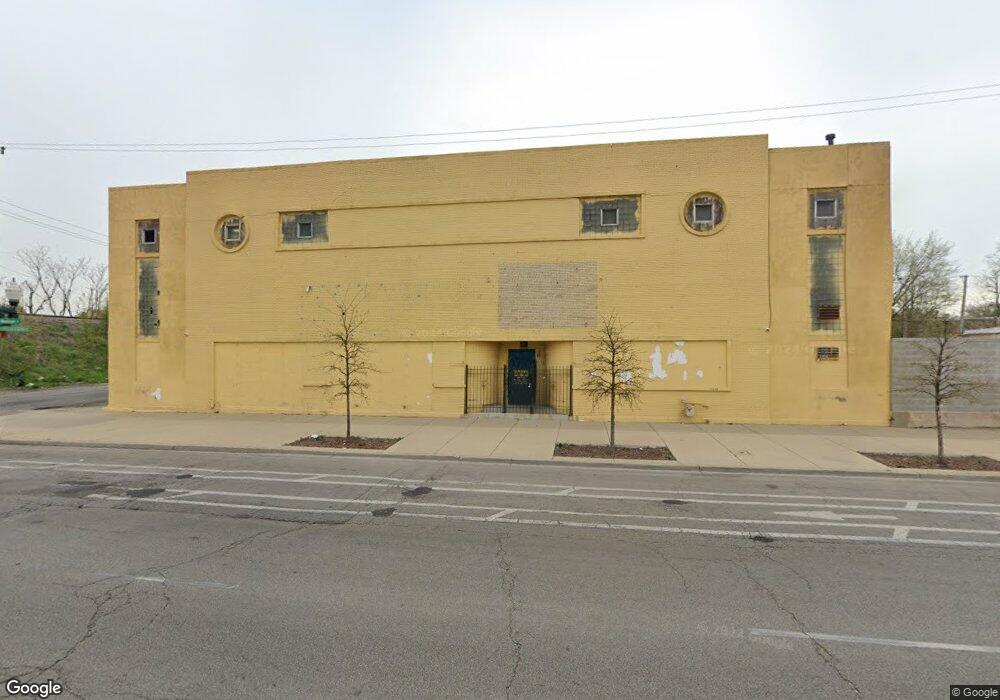
4540 W Madison St Chicago, IL 60624
Garfield Park Neighborhood
--
Bed
--
Bath
17,500
Sq Ft
0.7
Acres
About This Home
This home is located at 4540 W Madison St, Chicago, IL 60624. 4540 W Madison St is a home located in Cook County with nearby schools including Hefferan Elementary School, Marshall Metropolitan High School, and KIPP Academy Chicago Campus.
Ownership History
Date
Name
Owned For
Owner Type
Purchase Details
Closed on
Aug 16, 2023
Sold by
Looking Glass Opportunity Fund Ltd
Bought by
Sgt Holdings Llc
Home Financials for this Owner
Home Financials are based on the most recent Mortgage that was taken out on this home.
Original Mortgage
$492,000
Outstanding Balance
$481,565
Interest Rate
6.96%
Purchase Details
Closed on
Sep 23, 2019
Sold by
Bonlo Llc
Bought by
Looking Glass Opportunity Fund Ltd
Home Financials for this Owner
Home Financials are based on the most recent Mortgage that was taken out on this home.
Original Mortgage
$500,000
Interest Rate
5.75%
Mortgage Type
Commercial
Purchase Details
Closed on
Apr 10, 2006
Sold by
Laidlaw Transit Inc
Bought by
Bonlo Llc
Home Financials for this Owner
Home Financials are based on the most recent Mortgage that was taken out on this home.
Original Mortgage
$354,000
Interest Rate
7.25%
Mortgage Type
Commercial
Create a Home Valuation Report for This Property
The Home Valuation Report is an in-depth analysis detailing your home's value as well as a comparison with similar homes in the area
Home Values in the Area
Average Home Value in this Area
Purchase History
| Date | Buyer | Sale Price | Title Company |
|---|---|---|---|
| Sgt Holdings Llc | $1,230,000 | Stewart Title Guaranty Company | |
| Looking Glass Opportunity Fund Ltd | $250,000 | First American Title | |
| Bonlo Llc | $600,000 | None Available |
Source: Public Records
Mortgage History
| Date | Status | Borrower | Loan Amount |
|---|---|---|---|
| Open | Sgt Holdings Llc | $492,000 | |
| Closed | Sgt Holdings Llc | $615,000 | |
| Previous Owner | Looking Glass Opportunity Fund Ltd | $500,000 | |
| Previous Owner | Bonlo Llc | $354,000 |
Source: Public Records
Tax History Compared to Growth
Tax History
| Year | Tax Paid | Tax Assessment Tax Assessment Total Assessment is a certain percentage of the fair market value that is determined by local assessors to be the total taxable value of land and additions on the property. | Land | Improvement |
|---|---|---|---|---|
| 2024 | $62,831 | $169,072 | $56,875 | $112,197 |
| 2023 | $60,756 | $249,436 | $43,750 | $205,686 |
| 2022 | $60,756 | $249,436 | $43,750 | $205,686 |
| 2021 | $59,581 | $249,436 | $43,750 | $205,686 |
| 2020 | $10,849 | $48,538 | $43,750 | $4,788 |
| 2019 | $9,784 | $48,538 | $43,750 | $4,788 |
| 2018 | $9,239 | $46,623 | $43,750 | $2,873 |
| 2017 | $9,057 | $41,927 | $37,187 | $4,740 |
| 2016 | $8,398 | $41,927 | $37,187 | $4,740 |
| 2015 | $7,683 | $41,927 | $37,187 | $4,740 |
| 2014 | $7,422 | $40,003 | $37,187 | $2,816 |
| 2013 | $7,276 | $40,003 | $37,187 | $2,816 |
Source: Public Records
Map
Nearby Homes
- 4456 W Madison St
- 4543 W West End Ave
- 4626 W Monroe St
- 4643 W Monroe St
- 4521 W Wilcox St
- 4704 W Monroe St
- 4718 W Monroe St
- 4720 W Washington Blvd
- 223 N Kolmar Ave
- 4501 W Maypole Ave
- 4453 W Adams St
- 4747 W Monroe St
- 4339 W Monroe St
- 4407 W Maypole Ave
- 4432 W Maypole Ave
- 4459 W Jackson Blvd
- 4407 W Adams St
- 217 N Kostner Ave
- 4810 W Washington Blvd
- 4821 W Washington Blvd
- 4528 W Madison St
- 4524 W Madison St
- 4533 W Washington Blvd
- 4557 W Madison St
- 4535 W Madison St
- 4529 W Washington Blvd
- 4529 W Washington Blvd
- 4523 W Washington Blvd
- 4523 W Washington Blvd Unit 25
- 4521 W Washington Blvd
- 4551 W Madison St
- 4519 W Washington Blvd
- 4517 W Washington Blvd Unit 1
- 4517 W Washington Blvd
- 4515 W Washington Blvd Unit 2
- 4511 W Washington Blvd
- 4534 W Monroe St
- 4530 W Monroe St
- 4528 W Monroe St
- 4524 W Monroe St